Global Warming: Causes, Impacts, and the Science of Climate Change
Since the Industrial Revolution, Earth's average surface air temperature has risen by approximately 1.5 °C (2.7 °F). While natural forces contribute to climate variability, the persistent and accelerating upward trend in temperature is a direct result of human activity. This phenomenon, known as global warming, is the primary driver of modern climate change—a broader term that encompasses the ongoing increase in global temperatures and the resulting disruptions to Earth's complex climate systems.
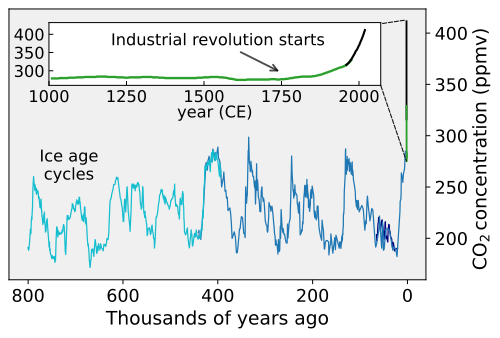
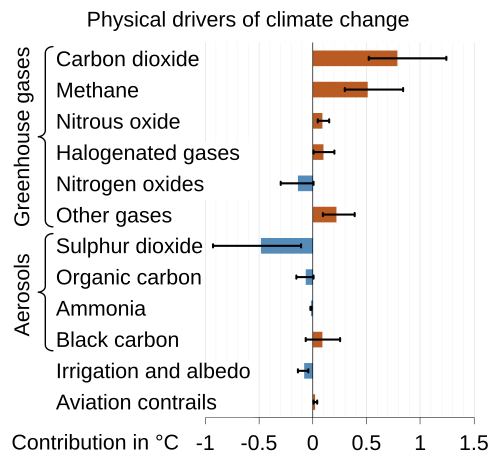
The modern rise in temperature is primarily fueled by the burning of fossil fuels, such as coal, oil, and natural gas, alongside deforestation and specific industrial and agricultural practices. These activities release greenhouse gases—molecules that trap heat in the lower atmosphere. Today, carbon dioxide (CO2) concentrations are roughly 50% higher than they were in the pre-industrial era, reaching levels not seen for millions of years.
Key Facts
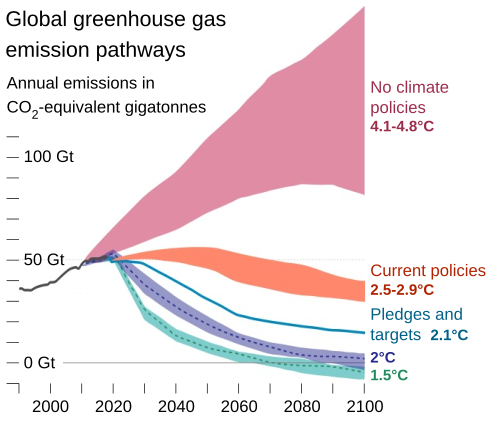
![CMIP6 multi-model projections of global surface temperature changes for the year 2090 relative to the 1850–1900 average. The current trajectory for warming by the end of the century is roughly halfway between these two extremes.[24][88][89]](/images/cd/ab/cdab433ce13c087e0858c7390f0e77f4976fd283807c97899cb10a12076ff40f.webp)
- Temperature Rise: Global average surface temperatures have increased by about 1.5 °C since the Industrial Revolution.
- Primary Driver: The burning of fossil fuels and deforestation are the main causes of increased greenhouse gas emissions.
- CO2 Levels: Atmospheric carbon dioxide is 50% higher than pre-industrial levels.
- Ocean Heat: Oceans absorb over 90% of the excess heat generated by global warming.
- Scientific Consensus: Studies indicate a scientific consensus between 98.7% and 100% that humans are causing climate change.
The Mechanics of Global Temperature Rise
The Greenhouse Effect
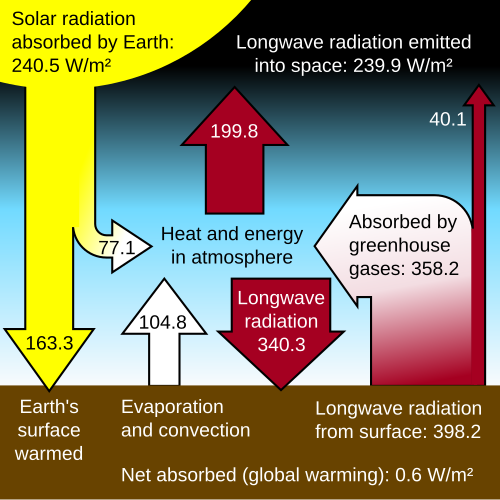
The greenhouse effect occurs when certain gases in the atmosphere absorb heat radiated from the Earth's surface after it has been warmed by sunlight. This insulating layer prevents heat from escaping into space, thereby warming the lower atmosphere. Carbon dioxide is the primary gas driving this process.
Historical Context and Observations
Proxy data from ice cores, tree rings, and corals allow scientists to reconstruct temperatures over the last 2,000 years, showing a sharp increase in the modern era. Recent decades have seen new high-temperature records substantially outpace new low-temperature records across much of the planet.
![Global surface temperature reconstruction over the past 2000 years using proxy data from tree rings, corals, and ice cores in blue.[44] Directly observed data is in red.[45]](/images/1d/23/1d23dc68550f618c1d8e035f816d8deb6d6ee1fbb89e7ac5dc6b6df4061b304e.webp)
![In recent decades, new high temperature records have substantially outpaced new low temperature records on a growing portion of Earth's surface.[54]](/images/20/f4/20f41f04b5ff3dc2edd091d0f9c7e4d42f469133878b2e6ebd8514cc550ba2ef.webp)
Oceanic Warming and Sea Level Rise
The world's oceans act as a massive heat sink, absorbing more than 90% of the heat trapped by greenhouse gases. This increase in ocean heat content contributes to the melting of polar ice and the thermal expansion of seawater, leading to a rise in global sea levels.
![There has been an increase in ocean heat content during recent decades as the oceans absorb over 90% of the heat from global warming.[55]](/images/32/f0/32f0e5bde2f3cee91829b80fd9564e3b7fc1ce70fd55f47917b90f8b20a838f9.webp)
![Historical sea level reconstruction and projections up to 2100 published in 2017 by the U.S. Global Change Research Program[199]](/images/df/0e/df0e0b61144f7d6933263b23cc8b80ab0e116bb74b27d4029aedb4342c0a6148.webp)
Drivers of Recent Warming
![Annual CO2 emissions by region. This measures fossil fuel and industry emissions. Land use change is not included.[407]](/images/51/4e/514ea573082eade6e8cfe1e3877968164faaefccecba8b2f24797cc908034205.webp)
Human-Induced Emissions
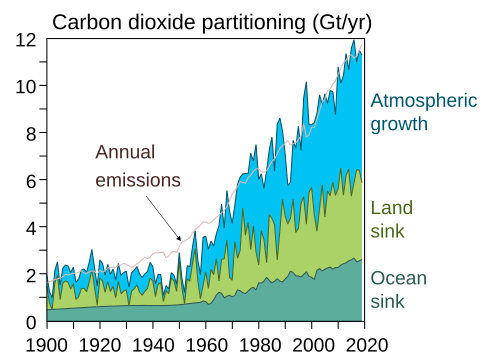
The Global Carbon Project highlights how various human sources have ramped up CO2 additions to the atmosphere. While the United States and Europe were early contributors, since 2000, emissions from China and other regions have surpassed them. However, on a per-person basis, the United States continues to generate CO2 at a significantly faster rate than other primary regions.
![The Global Carbon Project shows how additions to CO2 have been caused by different sources ramping up one after another.[114]](/images/41/1b/411be3f85d9ada0b9216f0e65708cb1d32a3350b0974b23ad216d2809268306a.webp)
![Since 2000, rising CO2 emissions in China and the rest of world have surpassed the output of the United States and Europe.[382][383]](/images/d1/ca/d1caf09d1a1c90dae093ad3077e50a85409d5c2f05197da68543cdeb8e2ca0c6.webp)
![Per person, the United States generates CO2 at a far faster rate than other primary regions.[382][384]](/images/d9/fc/d9fc393391c06e5363cb24485b835b63c26c479098036d81b9dd97ce27f7a553.webp)
Land Use and Carbon Sinks
Deforestation plays a critical role in warming. The rate of global tree cover loss has approximately doubled since 2001, with annual losses approaching the size of Italy. Forests act as carbon sinks—natural systems that absorb CO2 from the atmosphere. When forests are cleared, this capacity is lost, and stored carbon is often released.
![The rate of global tree cover loss has approximately doubled since 2001, to an annual loss approaching an area the size of Italy.[128]](/images/7f/a5/7fa55c366354a9c1a6c412277facfe5c6ae6faebf15465f3b5899c09af3d80e5.webp)
Natural Factors vs. Human Influence
Scientific assessments, including the Fourth National Climate Assessment, have concluded that neither solar activity nor volcanic eruptions can explain the observed warming trend. While aerosols and clouds can influence temperature, the dominant force remains human-induced greenhouse gas emissions.
![The Fourth National Climate Assessment ("NCA4", USGCRP, 2017) includes charts illustrating that neither solar nor volcanic activity can explain the observed warming.[151][152]](/images/37/fb/37fb81101f3ac28412dffb718b34e61be42ce066a3ea3d14c478eb7ecc702582.webp)
Climate Feedbacks and Tipping Points
![Data has been cherry picked from short periods to falsely assert that global temperatures are not rising. Blue trendlines show short periods that mask longer-term warming trends (red trendlines). Blue rectangle with blue dots shows the so-called global warming hiatus.[417]](/images/83/ed/83edabb1854d340bf1217bd0aac4a949bdea55b3a4a18a0bf11ce71f468daf95.gif)
Positive Feedback Loops
A positive feedback process occurs when an initial change triggers a response that intensifies that change. A prime example is the melting of sea ice: sea ice reflects 50% to 70% of sunlight, whereas the darker ocean reflects only 6%. As ice melts, the ocean absorbs more heat, which in turn melts more ice.
![Sea ice reflects 50% to 70% of incoming sunlight, while the ocean, being darker, reflects only 6%. As an area of sea ice melts and exposes more ocean, more heat is absorbed by the ocean, raising temperatures that melt still more ice. This is a positive feedback process.[158]](/images/ef/9d/ef9dea33ebe38bdff6b4e22e2bc843d0aa0f0ede589f7d7e12d16f87a143bfe8.jpg)
Tipping Points
Scientists warn of "tipping points"—critical thresholds where a small change can push a climate system into a completely different state, potentially leading to irreversible impacts on the global environment.
![Different levels of global warming may cause different parts of Earth's climate system to reach tipping points that cause transitions to different states.[209][210]](/images/22/cd/22cddb0f7366154ec8994881cb8c3aeca49aa68ac015088cdbafa8094367ff62.jpg)
Environmental and Human Impacts
Extreme Weather and Wildlife
Global warming has increased the frequency and intensity of extreme heat events worldwide. Extreme weather is expected to become progressively more common as the Earth continues to warm, threatening biodiversity and accelerating extinction risks for various species.
![In virtually all countries and territories around the world, scientists in the field of extreme event attribution have concluded that human-caused global warming has increased the number of days of extreme heat events over long-term norms.[191]](/images/c7/05/c705b5f0ba12d9692969eb518acb756f8ed62189adcb1bf9587c4c257a47ba64.webp)
![Extreme weather will be progressively more common as the Earth warms.[239]](/images/78/53/7853f7618ae97937041fb604bedafcb3e8d90583f8ad761959141d201e0b0bfd.webp)
Socioeconomic Consequences
The impacts of climate change extend to human health, food security, and economic stability. Rising temperatures and sea levels threaten coastal infrastructure and agricultural productivity, potentially leading to increased climate migration and deepening global inequality.
Mitigation and Adaptation
Reducing Emissions
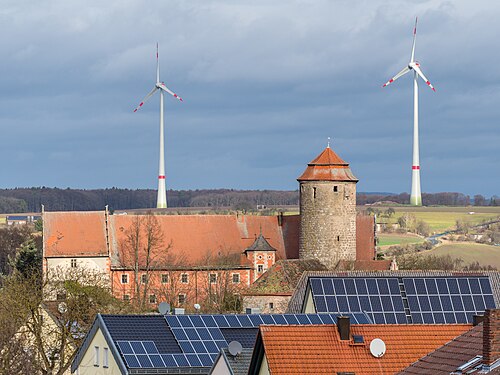
Transitioning from fossil fuels to clean energy sources, such as wind and solar power, is essential for reducing emissions. While renewables are increasing rapidly, coal, oil, and natural gas remain the primary global energy sources. Industry is currently the sector with the highest share of global emissions.
![Coal, oil, and natural gas remain the primary global energy sources even as renewables have begun rapidly increasing.[298][299]](/images/1f/0a/1f0aa3a87acf7d0a7967a29d74b99677509475ace52394baac9d9b1e9bf685e6.webp)

Adaptation Strategies
Adaptation involves adjusting to the current and expected effects of climate change. Examples include building seawalls to protect against storm surges, implementing green roofs to cool urban areas, and selectively breeding drought-resistant crops.
Scientific Consensus and History
The Evolution of Climate Science
The understanding of the greenhouse effect is not new. In 1856, Eunice Newton Foote demonstrated the heat-capturing effect of carbon dioxide. By 1912, scientific literature was already describing how burning coal creates CO2 and leads to global warming.
![Eunice Newton Foote showed carbon dioxide's heat-capturing effect in 1856, foreseeing its implications for the planet.[448] (Carbon dioxide was called "carbonic acid gas".)](/images/e9/de/e9def8b762619aaa0881448f640f02c46d3fa5e8e5f31d044c930e3e06b8ecd7.png)
![This 1912 article succinctly describes the greenhouse effect, how burning coal creates carbon dioxide to cause global warming and climate change.[456]](/images/08/d9/08d98f7fc6f469d17f6ea673d4b1e19c36e66d21c389a0706d8a11b181e4717c.jpg)
The Degree of Agreement
There is an overwhelming consensus among climate experts regarding the cause of global warming. Multiple studies from 2010 to 2021 show that consensus ranges from 98.7% to 100%, with the level of agreement correlating strongly with the level of expertise in climate science.
![The public substantially underestimates the degree of scientific consensus that humans are causing climate change (2022 data).[425] Studies from 2019 to 2021[426][5][427] found scientific consensus to range from 98.7 to 100%.](/images/69/99/69997dfb693ee28cb852137d1c21625e3e21e644ff584e3156679c4935f9692d.webp)
![Scientific consensus on causation: Academic studies of scientific agreement on human-caused global warming among climate experts (2010–2015) reflect that the level of consensus correlates with expertise in climate science.[462] A 2019 study found scientific consensus to be at 100%,[426] and a 2021 study concluded that consensus exceeded 99%.[5] Another 2021 study found that 98.7% of climate experts indicated that the Earth is getting warmer mostly because of human activity.[463]](/images/1f/65/1f651ff9d64de082da1053bf7ac92807d4d8e1ee31d9c8381201b5dac33b6800.webp)
| Category | Primary Factors | Key Effect |
|---|---|---|
| Drivers | Fossil fuel combustion, Deforestation | Increased atmospheric CO2 and heat trapping |
| Feedbacks | Sea ice loss, Albedo reduction | Accelerated warming cycles |
| Environmental | Ocean warming, Glacial melt | Sea level rise, Habitat loss |
| Human | Extreme heat, Crop failure | Health risks, Economic instability |
Frequently Asked Questions
Is the current warming caused by the sun?
No. Scientific data, including reports from the Fourth National Climate Assessment, show that solar activity cannot explain the observed rise in global temperatures.
What is a carbon sink?
A carbon sink is any natural system, such as a forest, soil, or the ocean, that absorbs more carbon dioxide from the atmosphere than it releases.
What is the difference between global warming and climate change?
Global warming refers specifically to the increase in Earth's average surface temperature, while climate change is a broader term that includes global warming and its wider effects on the climate system.
How much has the Earth warmed since the Industrial Revolution?
The Earth's average surface air temperature has increased by approximately 1.5 °C (2.7 °F).
What is a positive feedback loop in climate science?
It is a process where an initial change (like warming) triggers a response (like melting ice) that further amplifies the original change, leading to more warming.