Contour Lines: Mapping the Invisible Patterns of Our World
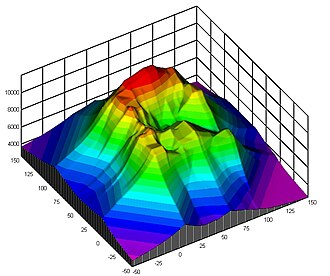
Have you ever looked at a map and wondered how a flat piece of paper could convey the height of a mountain or the intensity of a storm? The secret lies in contour lines. These lines, also known as isolines, isopleths, or isarithms, serve as a visual language that connects points of equal value, allowing us to visualize complex, three-dimensional data on a two-dimensional surface.
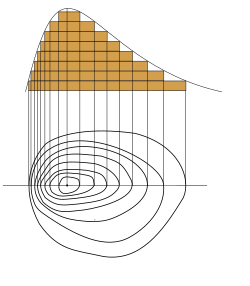
At its most fundamental level, a contour line represents a constant value of a function. In mathematics, it is a plane section of a three-dimensional graph. In practical application, these lines allow scientists, cartographers, and economists to track everything from the depth of the ocean to the spread of air pollution.
Key Facts
- Definition: A contour line joins points that share the same specific value (e.g., elevation, temperature, or pressure).
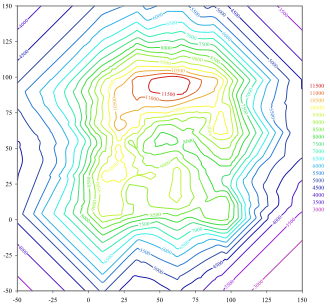
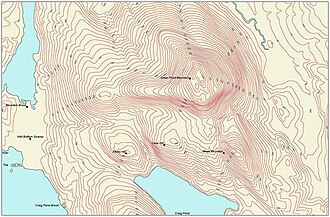
- Gradient: The steepness of a change is indicated by the spacing of lines; close lines mean a steep gradient, while widely spaced lines indicate a gentle slope.
- Perpendicularity: The gradient of a function is always perpendicular to its contour lines.
- Terminology: While "contour line" is common in geography, terms like "isobar" (pressure) and "isotherm" (temperature) are used in specific scientific fields.
The Evolution of Mapping Techniques
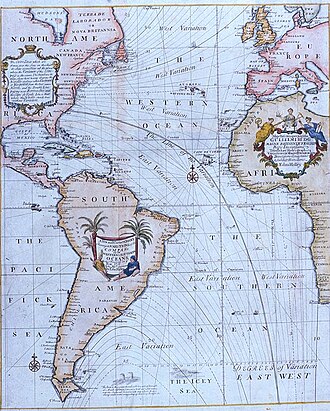
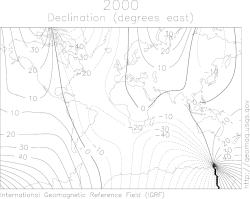
The concept of joining points of equal value has been rediscovered throughout history. One of the earliest known examples is an isobath—a contour line representing constant depth—found on a 1584 map of the river Spaarne by Pieter Bruinsz. By 1701, Edmond Halley utilized isogons (lines of equal magnetic variation) on his charts.
As the 18th and 19th centuries progressed, the use of these lines became more sophisticated. From Domenico Vandelli's land surface maps in 1746 to the widespread adoption of contour lines by the British Ordnance Survey in 1843, the ability to represent terrain became a standard in European cartography. Even the use of isobaths on nautical charts only became routine in the mid-19th century.
Common Types of Contour Lines
Because these lines can represent almost any measurable variable, a diverse vocabulary has emerged to describe them. The specific term used often depends on the scientific discipline involved.
Meteorology and Climate
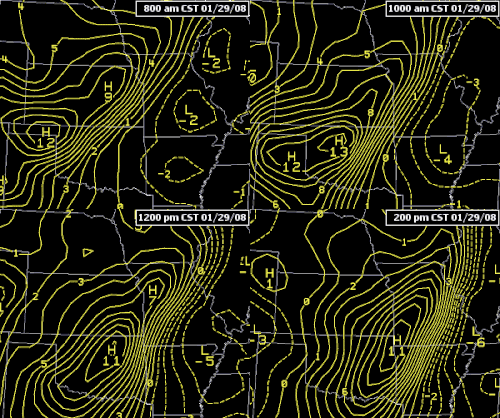
Meteorologists rely heavily on contouring to predict weather patterns. By interpolating data from weather stations and satellites, they create maps that show atmospheric changes.
- Isobars: Lines of constant atmospheric pressure. These are essential for understanding wind direction and magnitude.
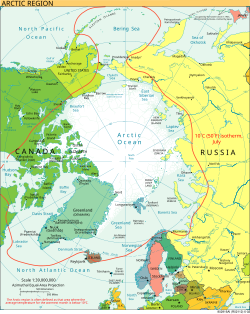
- Isotherms: Lines connecting points of equal temperature. Alexander von Humboldt famously used these to study the geographical distribution of plants.
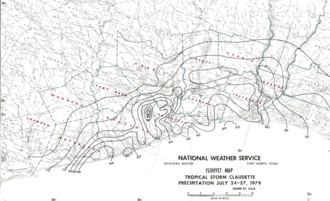
- Isohyets: Lines representing equal rainfall over a specific period.
- Isohels: Lines of constant solar radiation.
Geography and Oceanography
In physical geography, contour lines are the primary tool for visualizing the shape of the Earth's surface.
- Topographic Contours: Used to show elevation above a reference point, such as mean sea level.
- Isobaths: Used in bathymetry to show the depth of water bodies.
- Isoclines: Lines that join points with an equal slope.

Magnetism and Economics
Beyond the physical landscape, contouring applies to invisible forces and abstract data. In geomagnetics, isogonic lines show variations in magnetic direction, while isodynamic lines connect points of equal magnetic force intensity.
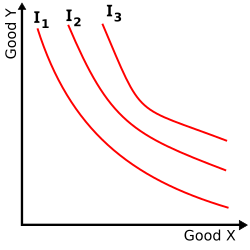
In the realm of economics, contour lines can represent utility or cost. For instance, an indifference map uses curves to show combinations of goods that provide the same level of satisfaction to a consumer. Similarly, isochrones can map equivalent travel times to a specific destination.
Summary of Common Isoline Terms
| Term | Variable Measured | Field of Study |
|---|---|---|
| Isobar | Atmospheric Pressure | Meteorology |
| Isotherm | Temperature | Climatology |
| Isohyet | Rainfall | Meteorology |
| Isobath | Water Depth | Oceanography/Bathymetry |
| Isogon | Direction/Angle | Magnetics/Meteorology |
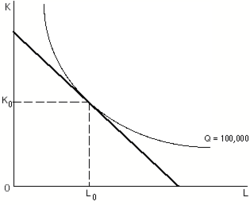
| Isoquant | Production Quantity | Economics |
Frequently Asked Questions
What is a contour interval?
The contour interval is the constant difference in elevation (or value) between two successive contour lines on a map.
How can I tell if a slope is steep from a map?
You can determine steepness by looking at the spacing of the lines. When contour lines are packed closely together, it indicates a steep slope. When they are far apart, the terrain is relatively flat or gentle.
What is the difference between an isopleth and an isometric line?
Generally, an isopleth depicts a variable that must be calculated from data collected over an area (like population density), whereas an isometric line is used for variables that can be measured directly at a specific point.
What does it mean when contour lines merge?
In topographic mapping, when two or more contour lines merge, it typically indicates the presence of a cliff or a vertical drop.
Why are isobars important for weather forecasting?
The distribution and spacing of isobars are closely related to wind patterns. By analyzing isobaric maps, meteorologists can predict the direction and strength of the wind field.