San Leandro Demographics: Population Trends and Community Profile
San Leandro has evolved from a small settlement into a vibrant, densely populated urban center. Over the last century and a half, the city has experienced significant growth, transforming its social and ethnic landscape to become a diverse hub of residents and families.
The city's growth trajectory shows a steady climb from just 426 residents in 1870 to over 91,000 by 2020. This expansion reflects broader regional trends of urbanization and the attraction of the area for immigrants and working professionals.
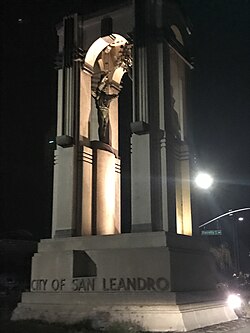
Key Facts
- Total Population: 91,008 residents as of the 2020 Census.
- Population Density: 6,830.9 inhabitants per square mile.
- Median Age: 40.7 years.
- Diversity: 37.8% of the population is foreign-born (2023 estimate).
- Economic Status: Median household income of $98,063 (2023 estimate).
- Urbanization: 100% of residents live in urban areas.
Population Growth and History
San Leandro's population history is marked by periods of rapid acceleration. The most dramatic growth occurred between 1950 and 1960, where the population jumped from 27,542 to 65,962, a growth rate of 139.5%.
| Census Year | Population | Percentage Change (%) |
|---|---|---|
| 1870 | 426 | — |
| 1900 | 2,253 | — |
| 1930 | 11,455 | 100.9% |
| 1960 | 65,962 | 139.5% |
| 2000 | 79,452 | 16.5% |
| 2020 | 91,008 | 7.1% |
Racial and Ethnic Composition
The city has seen a notable shift in its ethnic makeup over the last two decades. There has been a significant increase in the Asian and Hispanic populations, while the Non-Hispanic White population has decreased as a percentage of the total.
By 2020, Asian alone (Non-Hispanic) residents made up 35.56% of the population, and Hispanic or Latino residents of any race accounted for 28.55%. Non-Hispanic White residents decreased from 42.35% in 2000 to 19.63% in 2020.
Language and Education
Reflecting its diverse population, the 2023 American Community Survey (ACS) estimates indicate a multilingual community. While 46.3% of residents aged 5 or older speak only English at home, 28.0% speak Asian or Pacific Islander languages and 20.5% speak Spanish.
Educational attainment is also high, with 83.7% of adults aged 25 or older being high school graduates and 33.7% holding a bachelor's degree.
Household and Housing Statistics
As of the 2020 Census, San Leandro consists of 31,799 households with an average size of 2.83 people. The community is characterized by a mix of family structures: 46.4% are married-couple households, while 24.0% are single-person households.
Housing density is high, with 2,469.3 units per square mile. The market is split relatively evenly between owners and renters, with 54.5% of occupied units being owner-occupied and 45.5% occupied by renters. The overall vacancy rate remains low at 3.3%.
Economic Indicators
The economic profile of San Leandro shows a strong median household income of $98,063 and a per capita income of $46,387 according to 2023 estimates. Despite this, economic challenges persist, with 8.6% of the total population living below the poverty line.
Frequently Asked Questions
What is the current population of San Leandro?
According to the 2020 Census, the population of San Leandro is 91,008.
What is the most common racial or ethnic group in San Leandro?
As of 2020, the largest group is Asian alone (Non-Hispanic) at 35.56%, followed by Hispanic or Latino residents at 28.55%.
What is the median age of residents in the city?
The median age in San Leandro was 40.7 years as of the 2020 Census.
How many people in San Leandro speak a language other than English at home?
Based on 2023 estimates, 53.7% of residents aged 5 or older speak a language other than English at home, including Spanish, Asian or Pacific Islander languages, and other Indo-European languages.
What is the homeownership rate in San Leandro?
Approximately 54.5% of occupied housing units are owner-occupied, while 45.5% are rented.