Public Transport: Systems, Evolution, and Environmental Impact
Public transport, also known as mass transit or public transportation, consists of shared passenger transport services available to the general public. Unlike private vehicles, these systems typically operate on fixed routes and schedules, charging standardized fares to cover operational costs, often supported by public subsidies.
While the definition can vary, common examples include city buses, trams, rapid transit systems, and ferries. While air travel is a form of shared transport, it is often excluded from general transit discussions due to its competitive, market-driven pricing structure. Intercity travel is primarily facilitated by coaches, airlines, and intercity rail, with high-speed rail networks expanding globally.
Key Facts
- Origins: The first organized city transit appeared in Paris in 1662 with the Carrosses à cinq sols.
- Environmental Benefit: Switching from a car to public transit for a 20-mile round trip can reduce an individual's CO2 emissions by 4,800 pounds per year.
- Energy Efficiency: In London (2006-2007), trains were five times more energy-efficient per passenger kilometer than personal cars.
- Global Reach: Over 160 cities worldwide operate rapid transit systems, spanning more than 8,000 km of track.
- Pandemic Impact: The COVID-19 pandemic caused a 79% drop in US public transport ridership at the start of 2020.
The Evolution of Public Transit
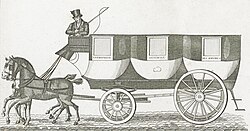
The history of urban transit began in Paris in 1662, where mathematician Blaise Pascal developed the Carrosses à cinq sols (five-sol coaches). Although this specific service lasted only fifteen years, it laid the groundwork for organized city travel. By the 19th century, buses were operating in Nantes (1826) and London (1829).
Modes of Public Transportation
Bus and Coach Services
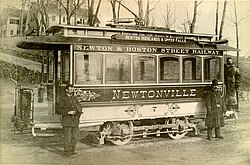
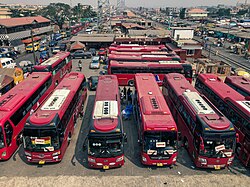
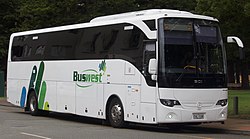
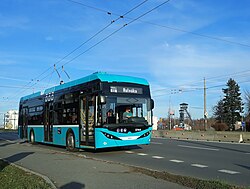
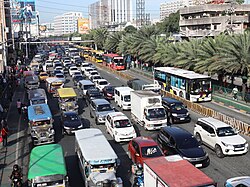
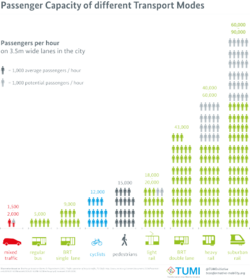
Buses are versatile transit options that range from local city loops to long-distance coaches. Modern innovations include trolleybuses—electric buses that draw power from overhead wires—and fully electric bus systems. To increase efficiency, many cities implement Bus Rapid Transit (BRT), which uses dedicated lanes to bypass traffic congestion.
![The pink bus rapid transit of Metz uses a diesel-electric hybrid driving system, developed by Belgian Van Hool manufacturer.[65]](/images/ff/8e/ff8e97b3887f6ac6849be769c6ee7ef4f7aa2de16a3da606d918505386282761.jpg)
Rail Systems
Passenger rail offers high capacity over various distances but requires significant upfront investment in tracks, signaling, and stations. Rail is categorized by its use case:
- Inter-city and High-Speed Rail: Designed for long-distance travel, often crossing national borders.
- Rapid Transit and Light Metro: High-capacity systems that move large numbers of people quickly over short distances.
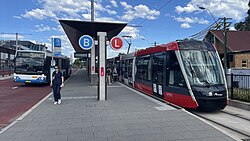
- Light Rail and Trams: Urban rail systems, including streetcars and rubber-tyred trams, that often share road space.
- Specialized Rail: This includes monorails, rack railways for steep gradients, and cable-propelled transit like funiculars and gondolas.
Water and Integrated Transit
Ferries and water buses (such as the vaporetto in Venice) provide essential transit in coastal or river-based cities. Additionally, many modern systems integrate with cycling to provide "last-mile" connectivity.
Operational Infrastructure and Management
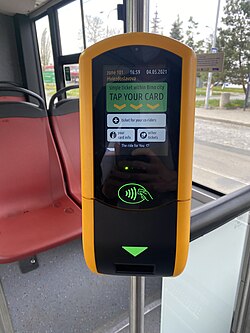
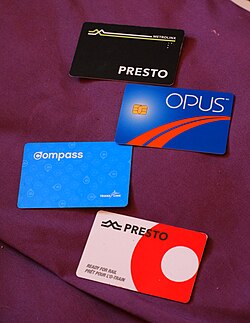
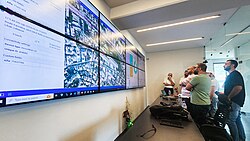
Effective transit relies on a complex network of interchanges, precise timetables, and diverse financing models. Digitalization has transformed the user experience through real-time tracking and contactless payment systems.
Safety and Accessibility
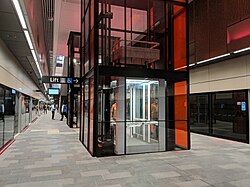
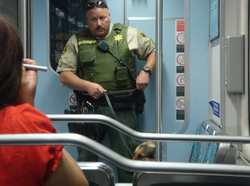
Modern transit focuses on inclusivity, such as installing lifts for disabled passengers, and security, often involving transit police or specialized patrols to ensure passenger safety.
Environmental and Societal Impact
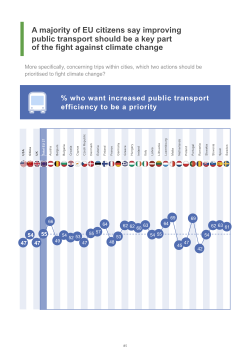
Public transportation is a critical tool for climate change mitigation. Beyond reducing individual carbon footprints, it alleviates traffic congestion and promotes efficient land use. It is estimated that these combined factors can save 37 million metric tons of CO2 annually.
Energy Consumption Comparison
To accurately compare transport modes, energy is measured per 100 passenger-kilometers (p-km). Data from Japan (1999) highlights the efficiency gap between private and public modes.
| Transport Mode | Energy Consumption (kWh per 100 p-km) |
|---|---|
| Rail | 6 |
| Bus | 19 |
| Air | 51 |
| Sea | 57 |
| Personal Car | 68 |
Challenges and Modern Disruptions
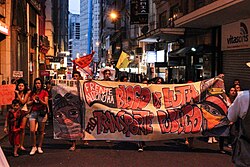
Public transit systems are susceptible to societal and economic shocks. Fare increases can lead to public protests, while health crises can devastate ridership.
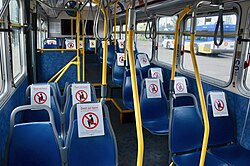
The COVID-19 pandemic had a profound impact, with ridership plummeting due to social distancing and the rise of remote work. In London, the Underground and buses saw declines of 95% and 85% respectively at the start of 2020. Systems responded by implementing measures such as social distancing markers on seating.
Frequently Asked Questions
What is the difference between a bus and a trolleybus?
A standard bus typically relies on an internal combustion engine or battery, while a trolleybus is an electric vehicle that draws power from two overhead wires to provide current and a return path to the power source.
How does public transit reduce CO2 emissions?
It reduces emissions by replacing multiple private car trips with a single high-capacity vehicle, reducing overall traffic congestion, and promoting more efficient urban land use.
What is Bus Rapid Transit (BRT)?
BRT is a high-capacity bus system that mimics rail transit by using dedicated lanes, specialized stations, and efficient boarding to avoid traffic congestion.
Why is energy measured per passenger-kilometer?
This measurement normalizes the data, allowing for a fair comparison between a small private car and a large train by calculating the energy used to move one person over a specific distance.
How did COVID-19 affect public transportation?
The pandemic caused a massive drop in ridership—up to 95% in some cities—due to lockdowns, remote work, and social distancing requirements, leading to significant revenue losses.