IOGP Data Reports: Tracking Global Upstream Safety and Environmental Performance
The International Association of Oil & Gas Producers (IOGP) maintains a comprehensive system of data collection and reporting to enhance safety and sustainability across the global upstream sector. By gathering data from participating member companies and their contractors, IOGP provides free, publicly available reports that serve as a benchmark for onshore and offshore operations worldwide.
These reports allow companies to measure their performance against industry peers, identify systemic risks, and implement data-driven improvements in operational safety and environmental stewardship.
Key Facts
- Global Scope: Covers both onshore and offshore upstream operations worldwide.
- Long-term Tracking: Occupational safety trends have been reported annually since 1985.
- Environmental Transparency: Annual environmental data has been published since 2001.
- Comprehensive Metrics: Reports span occupational safety, environmental impact, process safety, health management, land transport, and aviation safety.
- Public Access: All IOGP data reports are free and available to the public.
Occupational Safety and Health
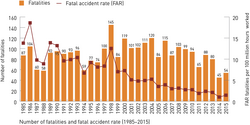
Since 1985, the IOGP has tracked annual trends in upstream safety, documenting significant improvements in industry performance over the decades. Today, this represents the industry's largest safety performance database, encompassing employees and contractors globally.
The reporting focuses heavily on fatal incidents, which are analyzed by activity, incident category, and causal factors. To provide deeper context, the reports include detailed descriptions of fatal incidents and high-potential events.
Health Management Tools
In collaboration with IPIECA, IOGP developed two specialized tools to assess health leading performance indicators—metrics that predict future health outcomes rather than just recording past incidents. These tools allow companies to compare performance internally across different departments or externally against other participating firms. Annual reports provide anonymous results and trends to highlight the benefits of proactive health management.
Environmental Performance
Launched in 2001, the environmental reporting program aims to increase operational transparency and allow member companies to benchmark their ecological footprint. Data is aggregated at both regional and global levels across six primary indicator categories:
- Gaseous emissions
- Energy consumption
- Flaring
- Aqueous discharges
- Non-aqueous drilling fluids retained on cuttings discharged to sea
- Spills of oil and chemicals
Process Safety Events (PSE)
Process safety is a disciplined framework used to manage the integrity of operating systems that handle hazardous substances, relying on rigorous design, engineering, and maintenance practices.
IOGP tracks Process Safety Events (PSE) based on Tier 1 and Tier 2 events. These are categorized by onshore versus offshore locations, drilling versus production activities, and the specific consequences and materials released. To ensure fair comparison, the data is normalized against work hours to establish PSE rates.
Transport and Aviation Safety
Recognizing the risks associated with logistics, IOGP published Report No. 365 in April 2005, providing recommended practices for land transportation safety applicable to operators, contractors, and subcontractors.
Since 2008, IOGP has published data on motor vehicle crashes (MVC), broken down by region and category. A specific focus is placed on rollover incidents. The reported metrics include:
- Total number of MVC fatalities.
- Number of crashes per reporting group and category.
- Motor vehicle crash rate, calculated as crashes per million kilometres.
Additionally, the IOGP collects and publishes data regarding aviation safety to maintain high standards for air transport in upstream operations.
Summary of IOGP Reporting Areas
| Reporting Area | Key Focus/Metrics | Start Year |
|---|---|---|
| Occupational Safety | Fatalities, causal factors, and high-potential events | 1985 |
| Environmental Performance | Emissions, energy, flaring, and spills | 2001 |
| Process Safety | Tier 1 & Tier 2 events normalized by work hours | Not Specified |
| Land Transport | MVC fatalities, crash rates, and rollovers | 2008 |
| Health Management | Leading performance indicators (with IPIECA) | Not Specified |
Frequently Asked Questions
Who provides the data for IOGP reports?
The data is collected from participating IOGP member companies and includes information regarding both their own employees and their contractor employees.
What is the difference between Tier 1 and Tier 2 process safety events?
While the source does not define the specific technical thresholds, it notes that process safety events are categorized into Tier 1 and Tier 2 to track the integrity of systems handling hazardous substances.
How is the motor vehicle crash rate calculated?
The motor vehicle crash rate is expressed as the number of motor vehicle crashes per million kilometres travelled.
Are the IOGP reports available for purchase?
No, the reports are free and made publicly available to encourage transparency and safety improvements across the industry.
What are health leading performance indicators?
These are tools developed by IOGP and IPIECA to assess proactive health management metrics, allowing companies to compare performance and identify potential health benefits before incidents occur.