Cladograms: Mapping Evolutionary Relationships through Cladistics
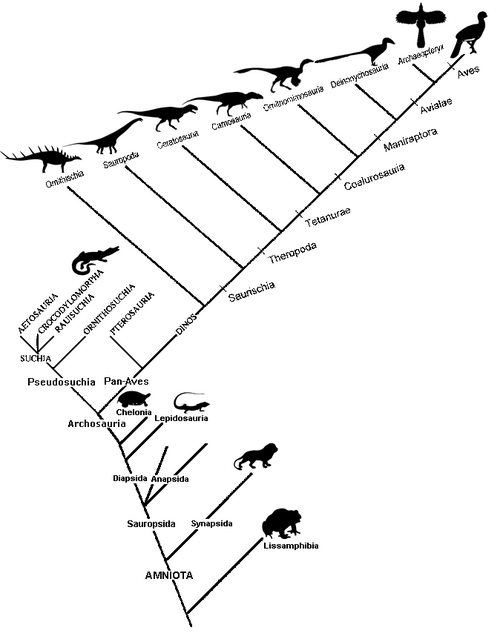
In the study of biology, understanding how different species are related is fundamental to grasping the history of life on Earth. A cladogram (derived from the Greek klados meaning "branch" and gramma meaning "character") is a specialized diagram used in cladistics to illustrate the common descent and evolutionary relationships between groups of organisms.
While often confused with general phylogenetic trees, cladograms are a specific subset. Unlike some phylogenetic models, they do not typically represent evolutionary time. Instead, they focus on the branching order of clades—groups consisting of a last common ancestor and all its descendants. Modern cladograms are frequently generated using computational phylogenetics, leveraging genetic data from DNA sequencing as part of a molecular systematics approach.
A cladogram consists of lines that branch off in various directions. Each branching point represents a hypothetical ancestor. While this ancestor is not necessarily a known physical entity, it allows scientists to infer the traits shared by the terminal taxa (the organisms at the ends of the branches) and reconstruct the order in which specific adaptations evolved.

Key Facts
- Purpose: To show evolutionary relationships based on common descent.
- Basis: Grouping is determined by shared derived characteristics (synapomorphies).
- Data Sources: Can be built using morphological (physical), behavioral, or molecular (DNA/RNA/protein) data.
- Hypothetical Nature: Branching points represent inferred ancestors rather than confirmed individual organisms.
- Distinction: Unlike phenograms, cladograms do not group organisms by overall similarity, but by evolutionary lineage.

Generating a Cladogram: Data and Methods
Molecular versus Morphological Data
Historically, cladistic analysis relied on morphological data, such as skull structure or cellular organization, and occasionally behavioral data. However, the rise of affordable DNA sequencing has shifted the field toward molecular systematics.
Researchers use various methods to infer phylogeny from molecular data. While the parsimony criterion is common, other non-Hennigian approaches like maximum likelihood incorporate explicit models of sequence evolution. Additionally, genomic retrotransposon markers are used because they are generally less prone to reversion and homoplasies (traits that appear similar but evolved independently).
Plesiomorphies and Synapomorphies
To build an accurate cladogram, researchers must distinguish between two types of character states:
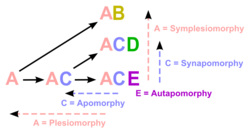
- Plesiomorphies: Ancestral character states.
- Synapomorphies: Derived character states.
Only synapomorphies provide evidence for grouping. To determine which is which, scientists compare the "in-group" to one or more outgroups (related species outside the group being studied). States shared by the outgroup and some in-group members are called symplesiomorphies. Conversely, traits unique to a single terminal are autapomorphies and do not help in grouping different taxa.
The Challenge of Homoplasies
A homoplasy occurs when a character state is shared by two or more taxa but not because of a common ancestor. This happens through two primary mechanisms:
- Convergence: The independent evolution of the same trait in distinct lineages (e.g., the wings of birds, bats, and insects).
- Reversion: A lineage returning to an ancestral character state.
Homoplasies can confound analysis and lead to false hypotheses. They are often detected when a trait's distribution is "unparsimonious" (too complex) compared to the rest of the data on the cladogram.
Cladogram Selection and Algorithms
Because the number of possible cladograms is astronomical, computers use mathematical optimization to find the "best" tree. These algorithms minimize a specific metric to ensure the tree is consistent with the data. Common algorithms include least squares, neighbor-joining, parsimony, maximum likelihood, and Bayesian inference.
Since some algorithms can get stuck in a "local minimum" (a good solution, but not the absolute best), many use a simulated annealing approach to increase the chances of finding the global optimum.
Measuring Tree Accuracy and Homoplasy
Scientists use several statistical indices to evaluate how well a cladogram fits the data:
| Metric | Full Name | What it Measures |
|---|---|---|
| CI | Consistency Index | The minimum amount of homoplasy implied by the tree. |
| RI | Retention Index | How well synapomorphies explain the tree structure. |
| RC | Rescaled Consistency Index | A stretched CI (CI × RI) ranging from 0 to 1. |
| HI | Homoplasy Index | The inverse of the Consistency Index (1 − CI). |
| HER | Homoplasy Excess Ratio | Observed homoplasy relative to the maximum theoretical homoplasy. |
Frequently Asked Questions
What is the difference between a cladogram and a phenogram?
A cladogram groups organisms based solely on synapomorphies (shared derived traits) to show evolutionary lineage. A phenogram, resulting from phenetic algorithms, groups organisms by overall similarity, treating both ancestral and derived traits as evidence.
Why is the choice of an outgroup important?
The outgroup is used to determine which traits are ancestral (plesiomorphies) and which are derived (synapomorphies). Choosing a different outgroup can fundamentally change the resulting topology of the tree.
What is a basal clade?
A basal clade is the earliest clade of a given taxonomic rank to branch off within a larger clade, located toward the root of the tree.
How does the Incongruence Length Difference (ILD) test work?
The ILD test measures whether combining different datasets (like morphological and molecular data) results in a significantly longer tree. It uses random partitioning and p-values to determine if the datasets are congruent.
Can a cladogram show exactly when a species evolved?
Generally, no. Cladograms show the relative order of branching (who is more closely related to whom) rather than absolute evolutionary time.