Tropical Cyclones: Mechanics, Classification, and Climate Impact
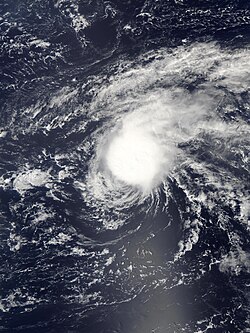
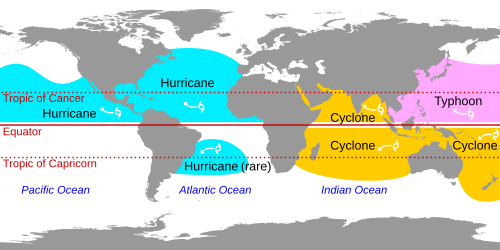
A tropical cyclone is a powerful, rapidly rotating storm system characterized by a low-pressure center, a closed low-level atmospheric circulation, and strong winds. These systems feature a spiral arrangement of thunderstorms that generate heavy rain and squalls. Depending on where they form and their intensity, these storms are known by different names: hurricanes in the Atlantic and northeastern Pacific, typhoons in the northwestern Pacific, and simply cyclones in the Indian Ocean and South Pacific.
On average, between 80 and 90 named tropical cyclones form globally each year. More than half of these reach hurricane-force winds, defined as speeds of 65 knots (120 km/h; 75 mph) or greater.
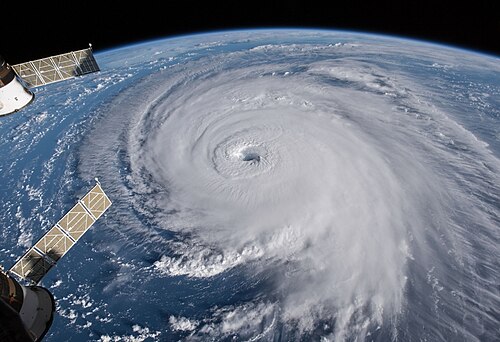
Key Facts
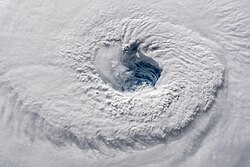
- Energy Source: Powered by the evaporation of warm ocean water, which condenses into clouds and rain.
- Global Frequency: Approximately 80 to 90 named storms occur annually.
- Size Range: Typically span between 100 and 2,000 km (62 to 1,243 mi) in diameter.
- Equatorial Limit: Rarely form within 5° of the equator due to the Earth's rotation and angular momentum.
- Climate Link: Warming oceans can increase the duration, occurrence, and intensity of these storms.
How Tropical Cyclones Form
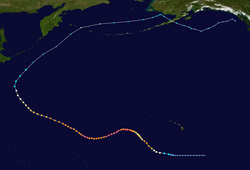
Tropical cyclones typically originate over large bodies of relatively warm water. Unlike mid-latitude cyclonic storms (such as European windstorms or nor'easters), which are driven by horizontal temperature contrasts, tropical cyclones derive their energy from the ocean surface. As moist air rises and cools to saturation, water vapor condenses into clouds and rain, releasing the heat energy that fuels the storm.
The rotation of these storms is a result of the conservation of angular momentum imparted by the Earth's rotation as air flows inward toward the center. This physical requirement explains why cyclones are almost never found very close to the equator.
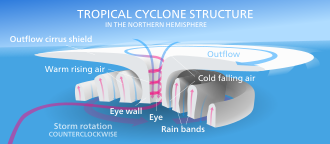
Regional Variations in Formation
Certain regions are more prone to cyclone development than others. The Atlantic Ocean and Caribbean Sea frequently see storms due to atmospheric instability and the African easterly jet. Conversely, tropical cyclones are very rare in the South Atlantic because of weak Intertropical Convergence Zones and consistently strong wind shear—the change in wind speed and direction at different altitudes, which can tear a developing storm apart.
Global Monitoring and Classification
Because these storms affect vast areas of the globe, responsibility for monitoring and warnings is divided among several regional centers.
| Hemisphere | Basin | Warning Center | Area of Responsibility |
|---|---|---|---|
| Northern | North Atlantic | US National Hurricane Center | Equator north, African Coast – 140°W |
| Northern | Eastern Pacific | US Central Pacific Hurricane Center | Equator north, 140–180°W |
| Northern | Western Pacific | Japan Meteorological Agency | Equator – 60°N, 180–100°E |
| Northern | North Indian Ocean | India Meteorological Department | Equator north, 100–40°E |
| Southern | South-West Indian | Météo-France Reunion | Equator – 40°S, African Coast – 90°E |
| Southern | Australian Region | BMKG / PNG NWS / BoM | Equator – 40°S, 90–160°E |
| Southern | Southern Pacific | Fiji Met / MetService NZ | Equator – 40°S, 160°E – 120°W |
The Influence of Climate Change
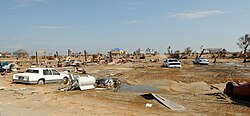
Climate change significantly alters the behavior and impact of tropical cyclones. Warming ocean waters act as an accelerator, potentially increasing the intensity and duration of storms. A critical effect is the intensification of the water cycle; cyclones concentrate moisture from vast areas and dump it as extreme precipitation over smaller regions. This can lead to severe river and overland flooding far inland, often overwhelming local water control structures.
Research indicates that climate change has already increased rainfall in several major hurricanes. For example, Hurricane Harvey saw a rainfall increase of 7–38%, and Hurricane Ian saw an increase of 18%.
![Climate change's increase of water temperatures intensified peak wind speeds in all eleven 2024 Atlantic hurricanes.[38]](/images/3a/cc/3acc8ae4b12f05215af10bd27bc27fcd0e0d9b3c6a43a9fd96bb3c29c7722db5.webp)
![Perceptions in the United States differ along political lines, on whether climate change was a "major factor" contributing to various extreme weather events experienced by respondents in 2023.[39] "Severe storms" includes hurricanes.](/images/d0/aa/d0aa8150b5862f1ea7225d74a97567458da02e7d7f18f5a222509d86469bccd8.webp)
Storm Structure and Intensity
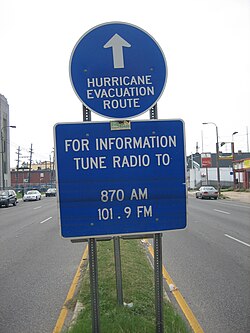
The strength of a cyclone is measured by sustained wind speeds, though its physical size is a separate metric. A storm's size is categorized by its diameter relative to degrees of latitude:
- Very Small/Minor: Less than 2 degrees latitude
- Small: 2 to 3 degrees latitude
- Medium/Average: 3 to 6 degrees latitude
- Large: 6 to 8 degrees latitude
- Very Large: Over 8 degrees latitude
While a larger size does not necessarily mean a stronger storm, it does mean more people are exposed to the hazards. Wind damage increases exponentially with speed; on the Saffir-Simpson scale, damages typically rise by a factor of four for every category increase.
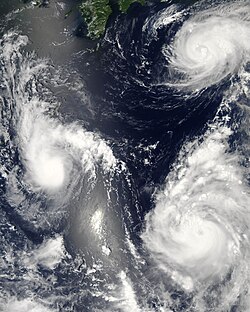
![Though large hurricane size does not imply strength—which is based on sustained wind measurements—it can mean that more people are exposed to its hazards.[128]](/images/3d/3e/3d3e0635b87381fd832eea8e950be2a24d38e2dfdce5e024a1f26060f6297545.webp)
![Wind damage varies exponentially with wind speed, so that small increases in wind strength can dramatically increase damage.[169] Damages rise by about a factor of four for every category increase in the Saffir–Simpson scale.[169]](/images/1f/c2/1fc205fd36e326e807cde523be68bc086f7730652f9646e837476215ff22c1bc.webp)
Observation and Forecasting
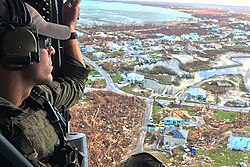
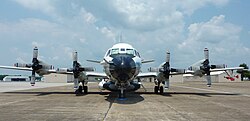
Meteorologists use a variety of tools to track and predict storm paths. One of the most direct methods involves "Hurricane Hunters"—specialized aircraft like the WP-3D Orion that fly directly into the eye of the storm to collect critical data.
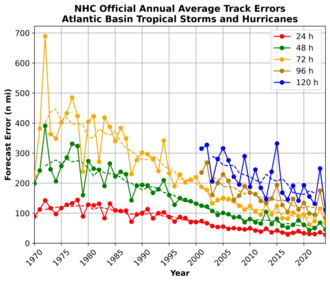
Since the 1970s, there has been a general decrease in error trends for path prediction, allowing for more effective evacuations and preparations. However, the financial cost of these storms continues to rise. The number of $1 billion Atlantic hurricanes nearly doubled between the 1980s and 2010s, driven by both climate change and the increasing number of people living in coastal areas.
![The number of $1 billion Atlantic hurricanes almost doubled from the 1980s to the 2010s, and inflation-adjusted costs have increased more than elevenfold.[170] The increases have been attributed to climate change and to greater numbers of people moving to coastal areas.[170]](/images/58/cb/58cb9067b593258265a17c6ced98a50b9eef07ca60705d0f253b9f2464c60c38.webp)
Frequently Asked Questions
What is the difference between a hurricane and a typhoon?
There is no scientific difference in the nature of the storm; the difference is purely geographical. Hurricanes occur in the North Atlantic and northeastern Pacific, while typhoons occur in the northwestern Pacific.
Why don't tropical cyclones form on the equator?
Cyclones require the Earth's rotation to create their characteristic spin (conservation of angular momentum). This effect is too weak within 5° of the equator to initiate the necessary rotation.
How does climate change affect hurricane rainfall?
Warming oceans increase the amount of water that evaporates into the atmosphere. Tropical cyclones then concentrate this increased moisture, leading to significantly heavier and more prolonged rainfall events.
What is wind shear and why does it matter?
Wind shear is the variation in wind speed and direction at different heights in the atmosphere. Strong wind shear can disrupt the vertical structure of a tropical cyclone, preventing it from forming or causing it to weaken.
Does a larger storm always mean a more dangerous storm?
Not necessarily. Strength is based on sustained wind measurements, not diameter. However, a larger storm is dangerous because it exposes a much wider geographic area and a larger population to hazards like wind and flooding.