Solar Irradiance and Insolation: Measuring the Sun's Energy on Earth
The energy driving Earth's climate, weather, and biological systems originates from the Sun in the form of electromagnetic radiation. To quantify this energy, scientists distinguish between two primary concepts: solar irradiance, which is the instantaneous power per unit area, and insolation (or solar irradiation), which is the total radiant energy accumulated over a specific period of time.
Measured in watts per square metre (W/m2) for irradiance and joules per square metre (J/m2) for irradiation, these metrics allow researchers to calculate the energy budget of our planet and optimize the placement of solar power technologies.
Key Facts
- Total Solar Irradiance (TSI): The average annual solar radiation at the top of Earth's atmosphere is approximately 1361 W/m2.
- Atmospheric Averaging: When averaged over the entire spherical surface of the Earth, the incoming solar radiation is roughly 340 W/m2.
- Surface Impact: On a clear day at sea level, maximum normal surface irradiance reaches approximately 1000 W/m2.
- TSI Stability: Total solar irradiance varies slowly, with changes during solar cycle 21 being only about 0.1% peak-to-peak.
- Measurement Tools: Pyranometers measure global irradiance, while pyrheliometers measure Direct Normal Irradiance (DNI).
Solar Radiation at the Top of the Atmosphere
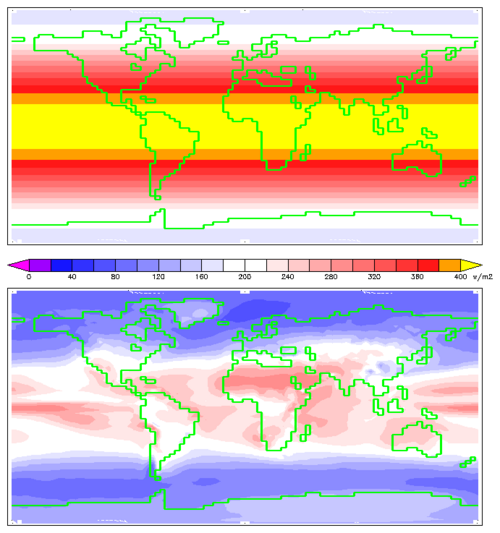
The distance from the Sun to the Earth (1 AU) determines the intensity of the radiation we receive. The circular disc of the Earth, as viewed from the Sun, receives a stable 1361 W/m2. However, because the Earth is a sphere, this energy is distributed across a larger surface area. Mathematically, the radiation arriving at the top of the atmosphere, averaged over the entire surface, is divided by four, resulting in 340 W/m2. This value is a critical component in calculating radiative forcing, which describes the imbalance in Earth's energy budget.
Variations in Solar Output
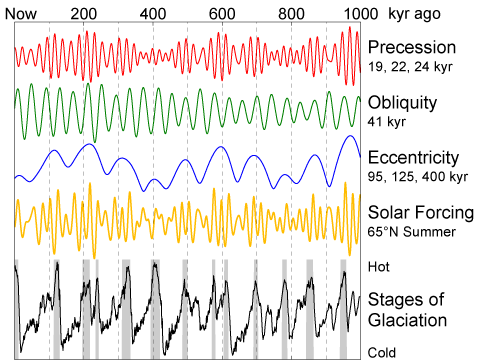
While the Sun appears constant, its output fluctuates. Total Solar Irradiance (TSI) changes on decadal timescales. Recent reconstructions suggest a minimal increase of 0.05% to 0.1% since the 17th-century Maunder Minimum. Ultraviolet (UV) irradiance is more volatile, varying by approximately 1.5% between solar maxima and minima for wavelengths between 200 and 300 nm.
Measuring Solar Energy
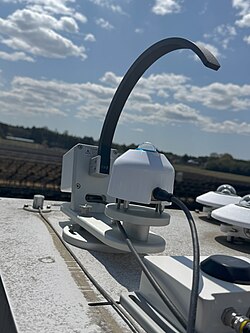
Accurate measurement is vital for climate research. Long-term drifts in radiometers can be mistaken for actual irradiance variations, potentially leading to incorrect climate models. To combat this, the TSI Radiometer Facility (TRF) uses a cryogenic radiometer in a vacuum to achieve high absolute accuracy, calibrated against the NIST Primary Optical Watt Radiometer to an uncertainty of 0.02%.
Ground-Based Instrumentation
On the Earth's surface, different instruments are used depending on the type of radiation being measured:
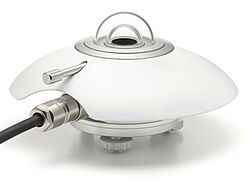
- Pyranometer: Used to measure global irradiance (the total radiation from the entire hemisphere).
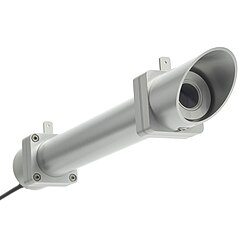
- Pyrheliometer: Mounted on a solar tracker to measure Direct Normal Irradiance (DNI), or beam irradiance, coming directly from the solar disc.
Solar Radiation on Earth's Surface
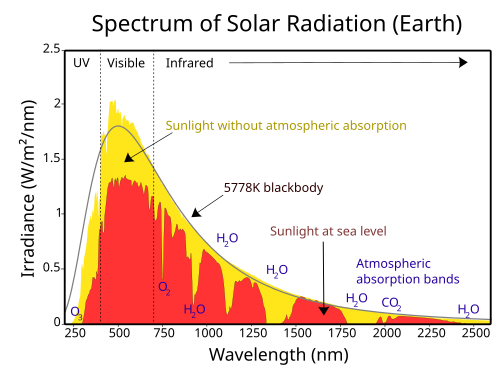
As sunlight passes through the atmosphere, it is attenuated by absorption and scattering. On a clear day, the maximum normal surface irradiance is about 1000 W/m2. Global radiation on a horizontal surface can reach 1120 W/m2 because it includes radiation scattered or reemitted by the atmosphere and surroundings.
The Projection Effect
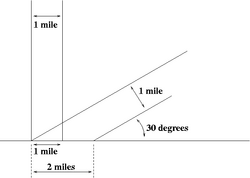
The amount of energy hitting a surface depends on the angle of incidence. This is known as the projection effect. A sunbeam hitting the ground at a 90° angle concentrates its energy, whereas a beam at a 30° angle distributes the same energy over twice as much area, reducing the irradiance per square metre.
Calculating Solar Angles
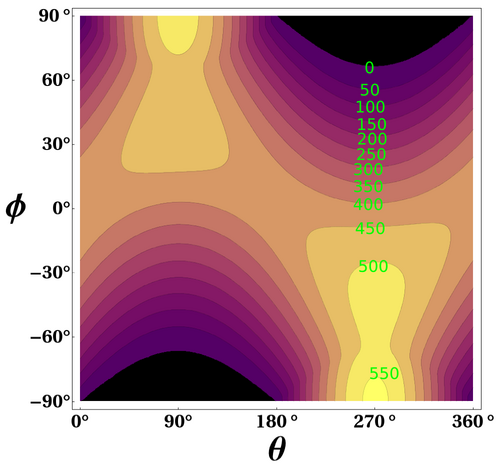
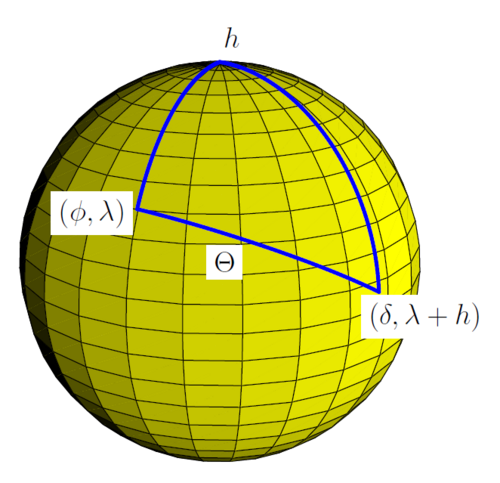
To determine the solar zenith angle (the angle between the sun and the vertical), scientists use the spherical law of cosines. This calculation involves the observer's latitude, longitude, the hour angle, and the solar declination (the latitude of the subsolar point).
Practical Applications
Solar Power Generation
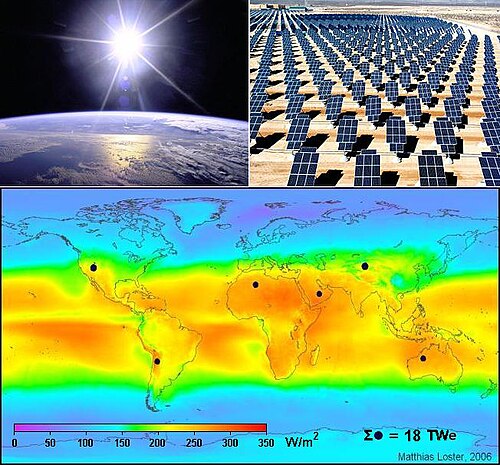
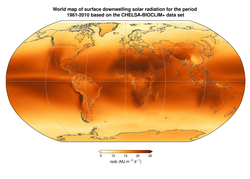
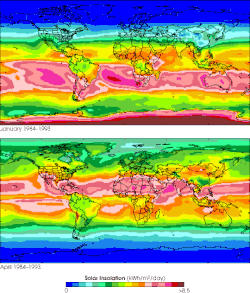
For solar panels, horizontal insolation values are often misleading. Because panels are tilted toward the Sun, they capture more energy than a flat surface would. For example, a properly tilted panel at 50° latitude receives 1860 kWh/m/y, compared to 2370 kWh/m/y at the equator. Interestingly, a horizontal panel at the poles during midsummer can receive more sunlight over 24 hours than a horizontal panel at the equator during the equinox.
![Global map of global horizontal radiation[5]](/images/41/34/413406ec9bdb311aa4003d5c4d829ec92203b7c98190dfd785a0d9e91cde8562.png)
![Global Map of Direct Normal Radiation[5]](/images/71/dd/71dd524a6fb216e684aedbcb0ff66d28eba3840e151dc0ecef8c661dd33a8a3a.png)
Climate Research and Cooling
Understanding irradiance is essential for passive daytime radiative cooling, a method proposed to reverse local temperature increases. By measuring a surface's capacity to reflect solar irradiance, researchers can quantify cooling power, which is estimated at approximately 100-150 W/m2 for specialized surfaces.
Summary of Solar Radiation Metrics
| Metric | Location/Condition | Approximate Value | Unit |
|---|---|---|---|
| Total Solar Irradiance (TSI) | Top of Atmosphere | 1361 | W/m2 |
| Averaged Global Irradiance | Top of Atmosphere (Spherical) | 340 | W/m2 |
| Max Normal Irradiance | Surface (Clear Day) | 1000 | W/m2 |
| Daily Average Insolation | Global Surface (No Clouds) | 6 (21.6 MJ) | kWh/m2 |
| UV Variation | Solar Max to Min | 1.5% | Percentage |
Frequently Asked Questions
What is the difference between solar irradiance and insolation?
Solar irradiance is the instantaneous power per unit area (measured in W/m2), while insolation (or solar irradiation) is the total energy received over a specific time period (measured in J/m2 or kWh/m2).
Why is the solar constant not the same as the average radiation on Earth's surface?
The solar constant (approx. 1361 W/m2) is measured at the top of the atmosphere. The value at the surface is lower due to atmospheric attenuation (absorption and scattering) and the projection effect caused by the Earth's curvature and the Sun's angle.
How does the tilt of a solar panel affect energy collection?
Tilting a panel reduces the projection effect by making the angle of incidence closer to 90°. This allows panels at higher latitudes to capture significantly more energy than they would if they were placed horizontally.
What is the role of the TSI Radiometer Facility (TRF)?
The TRF is a cryogenic radiometer that provides high-accuracy pre-launch validation for solar radiometers. It helps eliminate measurement errors, such as those caused by scattered light, ensuring that observed changes in irradiance are actual solar variations rather than instrument drift.
How does solar irradiance affect global climate forcing?
Small changes in TSI can impact Earth's energy balance. For instance, a 0.1% increase in irradiance imparts a climate forcing of 0.22 W/m2, which researchers use to estimate the transient climate response of the planet.