Phylogenetic Trees: Mapping the Evolutionary History of Life
A phylogenetic tree, or phylogeny, is a graphical representation that illustrates the evolutionary history and relationships between a set of species or taxa over a specific period. By analyzing similarities and differences in physical or genetic characteristics, biologists create these branching diagrams to visualize how different entities are related through common ancestry.
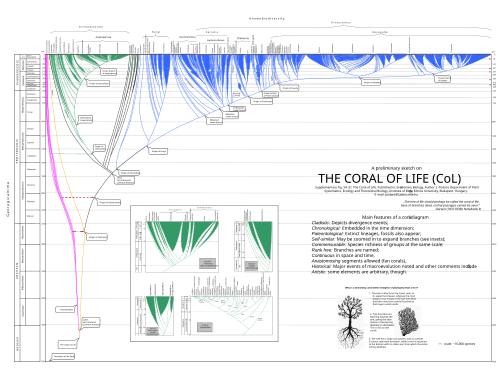
In the field of evolutionary biology, it is theorized that all life on Earth belongs to a single, massive phylogenetic tree. The scientific study of these trees is known as phylogenetics. A primary goal for researchers is to identify the optimal tree that represents the most accurate evolutionary ancestry. This has led to the rise of computational phylogenetics (or phylogeny inference), which develops the algorithms necessary to navigate the complex phylogenetic landscape and find these optimal structures.
Key Facts
- Phylogeny derives from the Greek words phûlon (race/lineage) and génesis (origin/source).
- Rooted trees identify a common ancestor, while unrooted trees only show relatedness.
- Bifurcating trees split into two descendants per node; multifurcating trees can have more.
- Chronograms use branch lengths to represent actual geological time.
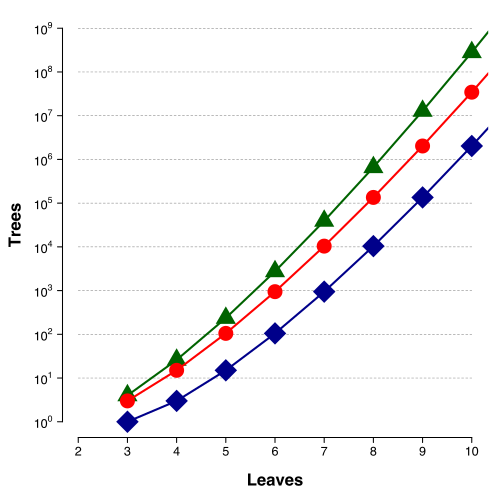
- Computational challenges increase exponentially as the number of leaf nodes (species) grows.
The Evolution of the Tree Concept
The concept of a "tree of life" evolved from ancient beliefs in a linear, ladder-like progression of life forms, such as the Great Chain of Being. Early scientific attempts to map these relationships appeared in Edward Hitchcock's 1840 book Elementary Geology, which featured a paleontological chart of plants and animals.
The most influential early representation was provided by Charles Darwin in his 1859 landmark work, On the Origin of Species. Darwin used tree diagrams to demonstrate that speciation occurs through the adaptive and semi-random splitting of lineages—a concept that remains fundamental to evolutionary biology today.
Types of Phylogenetic Trees
Rooted vs. Unrooted Trees
A rooted phylogenetic tree is a directed graph with a unique root node. This root represents the most recent common ancestor of all entities at the leaves. In these trees, internal nodes are considered hypothetical taxonomic units because they cannot be directly observed. Rooting is often achieved by using an outgroup (a related but distinct species) or through midpoint rooting and non-stationary substitution models.
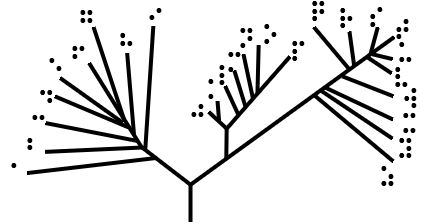
Conversely, unrooted trees illustrate the relatedness of leaf nodes without making assumptions about the ancestral root. While they do not identify the common ancestor, a rooted tree can be generated from an unrooted one by inserting a root based on additional data or the molecular clock hypothesis.
![An unrooted phylogenetic tree for myosin, a superfamily of proteins[7]](/images/5a/67/5a679ce2664be2d9c80e320d9aed2fa2e7f99c65316e7fdc928b4b926b62e06f.jpg)
Bifurcating and Multifurcating Structures
Trees are further categorized by how they branch. A bifurcating tree is a binary tree where each interior node has exactly two descendants (or three neighbors in an unrooted version). A multifurcating tree allows for more than two children at a single node, representing instances where the exact order of divergence is unknown or occurred rapidly.
Labeled vs. Unlabeled Trees
A labeled tree assigns specific values (such as species names) to its leaves. An unlabeled tree, often called a tree shape, defines only the topology (the structure of the branches) without identifying the specific entities.
Specialized Phylogenetic Diagrams
Depending on the data being presented, different types of diagrams are used:
- Dendrogram: A general term for any tree-like diagram, whether phylogenetic or not.
- Cladogram: Represents only the branching pattern; branch lengths do not signify time or the amount of change.
- Phylogram: A tree where branch lengths are proportional to the amount of character change.
- Chronogram: A tree where branch lengths explicitly represent geological time.
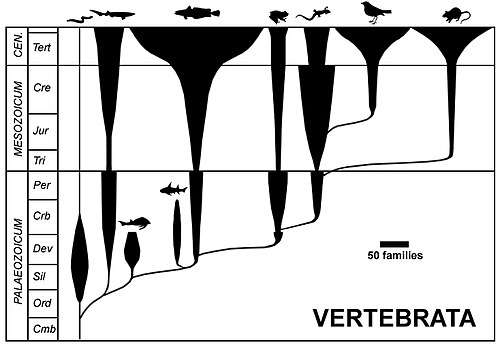
- Spindle Diagram: Used in evolutionary taxonomy to show vertebrate evolution, where the width of the spindle indicates the number of families.
- Phylogenetic Network: A directed acyclic graph used when a simple tree cannot capture complex histories, such as those involving hybridization or horizontal gene transfer.
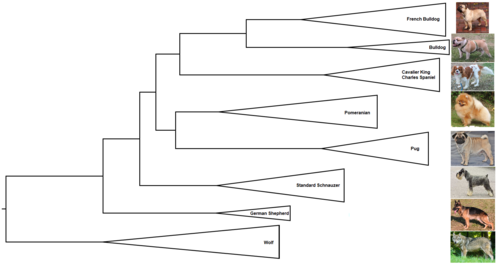
![A chronogram of Lepidoptera.[16] In this phylogenetic tree type, branch lengths are proportional to geological time.](/images/24/5e/245e2e6b42cda5b02d17702d740f740aca08745fceb0974f10adb4fc22ab3559.webp)
Tree Construction and Analysis
Building a phylogenetic tree requires rigorous methodology. Scientists assess tree-building techniques based on efficiency (computational speed and memory), power (effective use of data), consistency (repeatability), robustness (handling of model violations), and falsifiability.
To share these complex structures, standardized file formats are used, most notably the Nexus and Newick formats, which encode the nested structure of the tree and its branch lengths.
Comparison of Tree Types
| Tree Type | Branch Length Meaning | Represents Ancestors? | Primary Use |
|---|---|---|---|
| Cladogram | No meaning | No | Branching patterns |
| Phylogram | Amount of character change | Yes (if rooted) | Genetic divergence |
| Chronogram | Geological time | Yes (if rooted) | Timeline of evolution |
| Network | Varies | Yes/No | Hybridization/Gene transfer |
Limitations of Phylogenetic Analysis
While powerful, phylogenetic trees are hypotheses and not absolute facts. They are subject to falsification as new data emerges. Several factors can confound the results:
- Noisy Data: Genetic sequences may contain errors or misleading signals.
- Genetic Recombination: The shuffling of genetic material can obscure lineage.
- Horizontal Gene Transfer: The movement of genes between non-descendant species.
- Hybridization: Interbreeding between species that are not nearest neighbors.
Additionally, extinct species often lack high-quality DNA, making them difficult to place as terminal nodes. To overcome these limitations, researchers may use morphology, the presence of specific genes, or insertion/deletion events to find an evolutionary signal.
Frequently Asked Questions
What is the difference between a rooted and an unrooted tree?
A rooted tree has a single root node representing the most recent common ancestor of all leaves, providing a direction of time. An unrooted tree shows the relatedness between species without specifying which ancestor came first.
How do scientists determine the root of a tree?
Rooting is typically done by including an outgroup—a species known to be related to the group being studied but clearly outside of it—or by using mathematical methods like midpoint rooting.
What is a chronogram?
A chronogram is a specific type of phylogenetic tree where the lengths of the branches are proportional to actual geological time, allowing researchers to estimate when specific divergence events occurred.
Why are phylogenetic networks sometimes used instead of trees?
Networks are used when evolution is not strictly bifurcating. They can represent "reticulate" evolution, such as when species hybridize or exchange genes horizontally, which a standard tree structure cannot show.
What are the most common file formats for phylogenetic trees?
The most widely used standardized formats for distributing and sharing phylogenetic tree data are the Newick and Nexus formats.