Non-Hispanic White Population Trends in the United States
In the context of the United States census, Non-Hispanic Whites (also referred to as non-Latino Whites) are individuals classified as White who are not of Hispanic or Latino origin. This demographic represents a significant portion of the American population, though its relative share has shifted considerably over the last century due to changing migration and birth patterns.
According to the 2020 Census, the total population of this group was 203,890,513, which accounted for 61.6% of the total U.S. population. This figure includes 191,697,647 people who identified as White alone (57.84%) and 12,192,866 who identified as White in combination with other races (3.67%). More recent estimates from the American Community Survey as of July 1, 2024, place the population at approximately 191,382,624, representing about 56.3% of the total U.S. population.
Key Facts
- Current Share: Estimated at 56.3% of the U.S. population as of July 2024.
- Geographic Reach: Distributed throughout the contiguous United States.
- Primary Language: Predominantly American English.
- Religious Diversity: As of 2014, 48% identify as Protestant, 24% as unaffiliated, 19% as Catholic, and 3% as Jewish.
- Demographic Shift: The percentage of the total population has declined from 79.6% in 1980 to 57.8% in 2020.
Population Dynamics and Trends
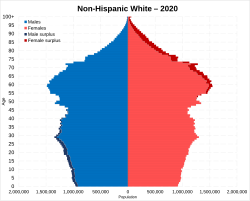
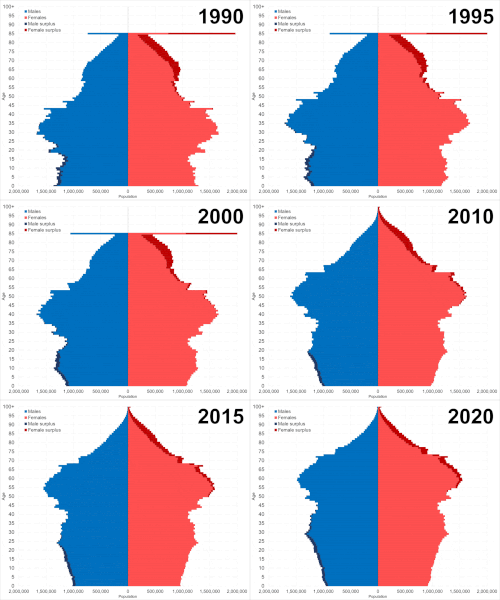
The demographic landscape of Non-Hispanic Whites has undergone a steady transformation. While the absolute number of individuals remained relatively stable or grew slightly between 1980 and 2010, their percentage of the overall U.S. population has decreased consistently.
| Year | Total Population | Percentage of U.S. Population | Actual Increase |
|---|---|---|---|
| 1980 | 180,256,103 | 79.6% | — |
| 1990 | 188,128,296 | 75.6% | 4.36% |
| 2000 | 194,552,774 | 69.1% | 3.41% |
| 2010 | 196,817,552 | 63.7% | 1.16% |
| 2020 | 191,697,647 | 57.8% | -2.60% |
| 2024 (est.) | 191,382,624 | 56.3% | 0.40% |
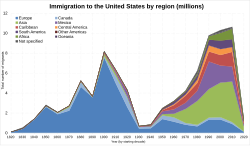
This decline in percentage is primarily attributed to two factors: immigration patterns and birth rates. Since World War II, immigration from European countries has declined sharply. In the 1950s, European immigrants averaged 56% of all arrivals; by 2009, approximately 90% of all immigrants came from non-European countries, particularly from Asia and Latin America.
Birth Rates and Fertility
Fertility rates among Non-Hispanic Whites have also seen a downward trend. The share of total U.S. births attributed to this group has dropped from 52.1% in 2016 to 49.1% in 2024. The total fertility rate—the average number of children born to a woman over her lifetime—fell from 1.72 in 2016 to 1.53 in 2024.
Regional Distribution
The distribution of the Non-Hispanic White population varies significantly by state. Some states, such as Maine, Vermont, and New Hampshire, maintain very high percentages of Non-Hispanic White residents (often exceeding 85%). Conversely, states like California, Texas, and Hawaii have seen the most dramatic decreases in the relative share of this population.
For example, in California, the Non-Hispanic White population share dropped from 57.2% in 1990 to 34.7% in 2020. In Texas, the share fell from 60.6% in 1990 to 39.8% in 2020. In contrast, some states like Utah and North Dakota have seen modest growth in the absolute number of Non-Hispanic White residents between 2010 and 2020.
Cultural Context
Culturally, the group is predominantly English-speaking and exhibits a diverse range of religious affiliations. While Protestantism remains the largest religious group, there is a growing number of unaffiliated individuals. In the realm of sports and public figures, the early 20th century saw the rise of iconic figures who reflected the dominant demographics of the era.

Frequently Asked Questions
What is the difference between White and Non-Hispanic White?
The term "White" in the U.S. Census includes anyone who identifies as White, regardless of their ethnicity. "Non-Hispanic White" specifically excludes those who identify as being of Hispanic or Latino origin.
Why has the percentage of Non-Hispanic Whites in the U.S. decreased?
The decrease is driven by a combination of declining immigration from European countries and lower fertility rates compared to other demographic groups in the United States.
Which states have the highest concentration of Non-Hispanic Whites?
States in the Northeast and Midwest, such as Maine, Vermont, and New Hampshire, typically have the highest percentages of Non-Hispanic White residents.
What are the current fertility trends for this group?
Fertility rates have been declining; the total fertility rate was 1.53 in 2024, and the group's share of total U.S. births fell below 50% for the first time in recent years, reaching 49.1% in 2024.