Multiracial Americans: History, Demographics, and Identity
Multiracial Americans, also referred to as mixed-race Americans, are individuals with ancestry from two or more races. This diverse group includes people who openly embrace their mixed heritage as well as those who may identify culturally or socially with a single racial group. In recent decades, the visibility and self-identification of multiracial individuals have grown significantly, reflecting broader shifts in American social norms and legal frameworks.
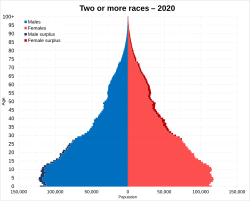
The 2020 United States Census recorded 33.8 million individuals, or approximately 10.2% of the total population, identifying as multiracial. However, genetic ancestry estimates suggest the actual number of Americans with mixed heritage may be even higher than self-reported data indicates.
Key Facts
- Population: 33,848,943 people (10.21% of the U.S. population) identified as mixed-race in the 2020 Census.
- Regional Concentration: Significant populations are found in the Southwestern United States and Florida.
- Census Evolution: The 2000 Census was the first to allow residents to select more than one race.
- Marriage Trends: Interracial marriages rose from 6.7% in 1980 to about 15% by 2010.
- Top States: California, Texas, and Florida have the highest numbers of multiracial residents.
Demographic Distribution
The distribution of multiracial Americans varies widely across the country. The highest concentrations are found in states with diverse immigration histories and large Hispanic populations. California leads the nation with over 5.7 million multiracial residents, followed closely by Texas and Florida.
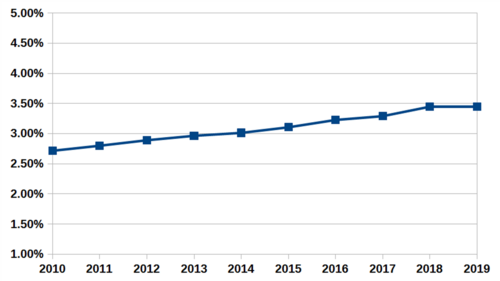
Data from the 2022 American Community Survey provides a more nuanced look at identity. While some estimates suggest up to 12.5% of the population identifies with multiple races, a significant portion of this figure includes those identifying as "some other race" in combination with a recognized category. Nearly 90% of these individuals are Hispanic or Latino, who make up over half of the total multiracial population in the U.S.
| Combination | Population | % of Total Population |
|---|---|---|
| White and "Some Other Race" | 26,317,236 | 7.9% |
| White and Black | 3,831,683 | 1.1% |
| White and Native American | 3,012,849 | 0.9% |
| White and Asian | 2,865,504 | 0.9% |
| Black and "Some Other Race" | 1,194,056 | 0.4% |
| Three or more races | 2,555,382 | 0.8% |
Historical Context and Legal Struggles
The history of multiracial identity in the U.S. is deeply intertwined with laws designed to prevent miscegenation (the mixing of different racial groups). During the 18th, 19th, and early 20th centuries, most states passed anti-miscegenation laws. Despite these prohibitions, interracial unions occurred, often through the exploitation of enslaved women by white slaveholders.
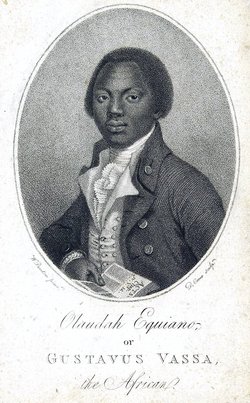
In the American West, laws specifically targeted relationships between European Americans and Asian or Latin American residents, with some marriage bans persisting into the 1950s. For much of U.S. history, racial classification was often determined by the mother's race or the one-drop rule, a social and legal principle where any amount of non-white ancestry categorized a person as non-white.

The Shift Toward Open Identity
Following the Civil Rights Era and the dismantling of formal segregation, it became more socially acceptable to form interracial unions. The multiracial identity movement gained momentum in the 1980s, leading to a push for federal recognition. A major victory occurred in 1997 when the Office of Management and Budget changed federal regulations to allow multiple racial responses, a change that became mandatory for all government forms by 2003.

Genetic Admixture and Self-Identification
There is often a difference between how people self-identify on a census and their actual genetic admixture (the presence of DNA from multiple ancestral populations). DNA analysis reveals that many Americans possess ancestry they may not be aware of or do not claim.
African-American and European Ancestry
Studies show varying degrees of European admixture among African Americans. A 2003 study of residents in Washington, D.C., found an average of 18.6% European ancestry. A 2010 study using ancestry-informative markers found African Americans to be, on average, 75.2% African, 19.6% European, and 8% Asian.
European-American Ancestry
Similarly, many self-identified White Americans have non-European ancestry. A 2003 analysis found that approximately 30% of self-identified White Americans have less than 90% European ancestry. Regional variations exist; for example, about 5% of White Americans in Louisiana and South Carolina possess 2% or more African ancestry.

Frequently Asked Questions
When did the U.S. Census first allow people to select more than one race?
The 2000 United States Census was the first to allow residents to check more than one ethno-racial identity, following a 1997 regulation change by the Office of Management and Budget.
What is the most common multiracial combination in the U.S.?
According to 2022 data, the largest group is those identifying as White and "Some Other Race," which accounts for 7.9% of the total population, largely driven by the Hispanic/Latino community.
How has the rate of interracial marriage changed over time?
Interracial marriage has increased significantly, rising from 6.7% of all new marriages in 1980 to approximately 15% in 2010.
What is the difference between self-identification and genetic admixture?
Self-identification is based on an individual's personal or cultural identity as reported on forms, while genetic admixture is the actual biological percentage of DNA inherited from different ancestral populations as determined by scientific testing.
Which U.S. states have the largest multiracial populations?
California has the largest multiracial population, followed by Texas, Florida, New York, and Illinois.