Logarithmic Scales and Graphic Data Representation
Visualizing data accurately requires choosing the right scale for the axes of a graph. While linear scales are the most common, they often fail to represent data that spans several orders of magnitude or follows non-linear growth. This is where logarithmic scales—scales based on logarithms rather than equal increments—become essential tools for scientists and engineers.
Key Facts
- Logarithmic scales condense wide ranges of data into manageable visual sizes.
- Exponential and power laws appear as straight lines on logarithmic plots.
- A semi-logarithmic plot uses a log scale on only one axis.
- A log–log plot uses log scales on both the horizontal and vertical axes.
- Modified log transforms allow for the representation of negative values and zero.
Types of Graphic Scales
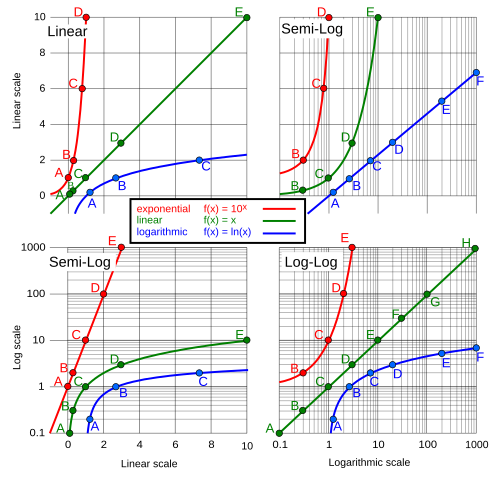
Depending on the nature of the data, researchers use different combinations of linear and logarithmic axes. A linear scale (lin–lin) is standard for data with a narrow range, such as a Y-axis ranging from 0 to 10. However, when data spans a vast range—for example, from 0.1 to 1000—a base-10 log scale is more effective.
There are four primary configurations for these plots: linear-linear, linear-log, log-linear, and log-log. These different scales change how mathematical functions, such as linear equations or logarithmic curves, are visually represented.
Semi-Logarithmic Plots
A semi-logarithmic plot occurs when only one axis—either the abscissa (X-axis) or the ordinate (Y-axis)—is scaled logarithmically. These are particularly useful for visualizing processes that grow or decay exponentially.
Log–Log Plots
When both the vertical and horizontal axes are scaled logarithmically, the result is a log–log plot. This format is indispensable for condensing information that spans more than one order of magnitude along both axes, making it easier to identify power-law relationships.
Practical Applications and Tools
Logarithmic scales are not just digital constructs; they have a long history in analog calculation. A slide rule utilizes logarithmic scales to perform multiplication and division, and nomograms frequently employ them for graphical calculations. Historically, before computer graphics became ubiquitous, scientists relied on specialized logarithmic graph paper.
One interesting mathematical property of these scales is that the geometric mean of two numbers is located exactly midway between them on a logarithmic axis.
| Plot Type | X-Axis Scale | Y-Axis Scale | Best Use Case |
|---|---|---|---|
| Linear-Linear | Linear | Linear | Small data ranges; simple linear relationships |
| Semi-Log | Linear or Log | Log or Linear | Exponential laws |
| Log-Log | Logarithmic | Logarithmic | Power laws; data spanning multiple orders of magnitude |
Advanced Extensions: Symmetric Log Plots
Standard logarithmic scales cannot handle zero or negative inputs because the logarithm of zero or a negative number is undefined (a singularity). To solve this, a modified log transform can be used to produce symmetric log plots. This is achieved using the formula:
Y = sgn(y) · log10(1 + |y / C|)
In this equation, sgn(y) represents the sign of the input, and C is a constant equal to 1/ln(10). This transformation allows for a continuous, symmetric representation of data that includes both positive and negative values.
Frequently Asked Questions
When should I use a logarithmic scale instead of a linear one?
You should use a logarithmic scale when your data covers a very large range of values that would be impossible to fit on a linear axis, or when you suspect the data follows an exponential or power law.
What is the difference between a semi-log and a log-log plot?
A semi-log plot has only one axis scaled logarithmically, while a log-log plot has both the X and Y axes scaled logarithmically.
How do power laws appear on a log-log plot?
On a log-log plot, power laws are represented as straight lines, which makes them much easier to identify and analyze than on a linear plot.
Can logarithmic scales represent negative numbers?
Standard logarithmic scales cannot represent zero or negative numbers. However, a modified log transform (symmetric log plot) can be used to include negative inputs by incorporating the sign of the value and a constant.
What is the relationship between the geometric mean and log scales?
On a logarithmic scale, the geometric mean of two numbers is positioned exactly halfway between those two numbers.