Dendrograms in Data Analysis and Biological Science
A dendrogram is a specialized diagram used to represent a tree graph. Derived from the Ancient Greek words déndron (meaning "tree") and grámma (meaning "drawing" or "mathematical figure"), this visualization tool is essential for organizing complex data into hierarchical structures across various scientific disciplines.
Applications of Dendrograms
Dendrograms are versatile tools employed in several distinct contexts to reveal patterns and relationships within datasets:
- Hierarchical Clustering: In statistics and data science, dendrograms illustrate the arrangement of clusters produced by hierarchical clustering analyses, showing how individual data points are grouped together.
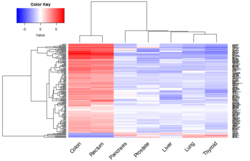
- Computational Biology: These diagrams are used to show the clustering of genes or samples. They are frequently positioned in the margins of heatmaps to provide structural context to the data.
- Phylogenetics: In the study of evolutionary history, a dendrogram displays the relationships among various biological taxa (groups of organisms). In this specific context, the diagram is commonly referred to as a phylogenetic tree.
How Hierarchical Clustering Works
To understand how a dendrogram is constructed, consider an example involving five taxa clustered using UPGMA (Unweighted Pair Group Method with Arithmetic Mean) based on a matrix of genetic distances.
The resulting dendrogram features a column of five initial nodes representing the individual taxa. The remaining nodes represent the clusters formed as the analysis progresses. The arrows or lines connecting these nodes represent the distance, or dissimilarity, between the elements.
A critical feature of these plots is that the distance between merged clusters is monotone, meaning it increases as the level of the merger rises. The height of each node is proportional to the value of the intergroup dissimilarity between its two daughter nodes. Individual observations are typically plotted at zero height on the right side of the diagram.
![Dendrogram of a hierarchical clustering (UPGMA) with the height of the nodes (adapted from bacterial 5S rRNA sequence data[1]).](/images/61/c3/61c3f14453c62cc2ec3f3f0ee69890be4264d4944c1f736b5191555cd4dde900.webp)
Other examples include the clustering of marine provinces based on the presence or absence of sponge species, or the mapping of the Tree of Life to identify the Last Universal Common Ancestor (LUCA).
![Dendrogram output for hierarchical clustering of marine provinces using presence / absence of sponge species.[2]](/images/5e/85/5e8516a9cd853a42a9c2a90fbc85acebb1e2903f8484bc5a94586f1088aea11c.jpg)
![A dendrogram of the Tree of Life. This phylogenetic tree is adapted from Woese et al. rRNA analysis.[3] The vertical line at bottom represents the last universal common ancestor (LUCA).](/images/d4/6f/d46f1fa07b2c848764bced774f3a340d6492dd27bd94b09f1c64f9b42dff7a2a.webp)
Key Facts
- Etymology: The term comes from the Greek words for "tree" and "drawing."
- Function: It visualizes hierarchical relationships and the degree of dissimilarity between data points.
- Biological Use: In phylogenetics, it is synonymous with a phylogenetic tree.
- Visual Logic: Node height corresponds to the level of dissimilarity between merged groups.
- Software Tools: Common tools for creating these diagrams include MEGA and yEd.
Summary of Dendrogram Usage
| Field | Primary Purpose | Common Terminology |
|---|---|---|
| Statistics | Visualizing cluster arrangements | Hierarchical Clustering |
| Computational Biology | Grouping genes or samples | Heatmap Margins |
| Phylogenetics | Mapping evolutionary relationships | Phylogenetic Tree |
Frequently Asked Questions
What is the difference between a dendrogram and a phylogenetic tree?
A phylogenetic tree is a specific type of dendrogram used in phylogenetics to display the evolutionary relationships among biological taxa.
What does the height of a node in a dendrogram represent?
The height of a node is proportional to the intergroup dissimilarity (distance) between the two daughter nodes it connects.
What is UPGMA in the context of dendrograms?
UPGMA is a method used for hierarchical clustering that calculates the average distance between clusters to determine how they should be merged in the tree.
Which software can be used to draw dendrograms?
Freeware options such as MEGA and yEd are commonly used for drawing and automatically arranging dendrograms.
How are dendrograms used with heatmaps?
In computational biology, dendrograms are often placed in the top and left margins of a heatmap to show how the rows (samples) and columns (genes) are clustered based on similarity.