Human Life Expectancy: Trends, Determinants, and Global Variations
Human life expectancy is a statistical estimate of the average number of years a person is expected to live given their current age. While often discussed as a single number, it is a complex demographic measure that reflects the intersection of medicine, sociology, and biology. The most frequent metric used is life expectancy at birth (LEB), which provides a snapshot of a population's overall health and survival conditions.
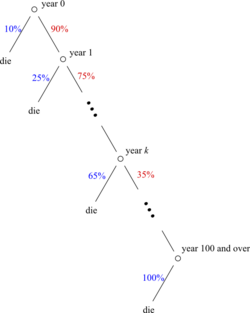
Demographers distinguish between two types of LEB: Cohort LEB, which tracks a specific group of people born in the same year until the last member dies, and Period LEB, which uses current mortality rates to estimate the lifespan of a hypothetical group. Most national and international reports rely on Period LEB to provide timely data on population health.
One critical nuance in these statistics is the impact of infant mortality—the death of children under one year of age. In historical or developing societies, high infant mortality rates drastically pull down the LEB. For example, a society might have an LEB of 30, but an individual who survives to age 5 might have a remaining life expectancy of 40 years. To account for this, researchers often use life expectancy at age 5 (e5) to better understand adult mortality rates.
![Life expectancy and healthy life expectancy in various countries of the world in 2019, according to WHO[1]](/images/87/ed/87ed8113a43a196af384862b596934ef8feeb359ec15a5c2caf2930cad5e986c.webp)
Key Facts
![Life expectancy at age 15 years[2] 70 67.5 65 62.5 60 57.5 55 52.5 50 47.5](/images/9c/57/9c571b65fca5c486ce99eb3651d1da500b47c2b3986ea8edcf8d61f914a5509c.png)
- Global Average: In 2019, the world life expectancy at birth was 73.3 years.
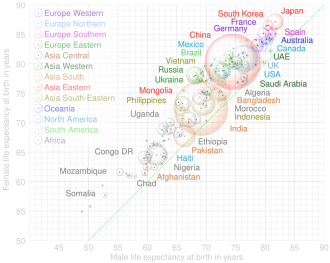
- Gender Gap: Females generally live longer than males; in 2019-2020, the global average for females was 75.6 years compared to 70.8 for males.
- Historical Shift: LEB has risen from roughly 20–30 years in ancient civilizations to over 70 years globally in the 21st century.
- Public Health Impact: In the US, 25 of the 30+ years gained in lifespan during the 20th century are attributed to public health advances.
- Economic Paradox: High healthcare spending does not always correlate linearly with higher life expectancy, as seen in some OECD countries.
![Map of the life expectancy at birth in the world in 2023 (UN estimate, smooth palette)[2] ⩾ 85 82.5 80 77.5 75 72.5 70 67.5 65 62.5 60 57.5 55 ⩽ 53](/images/50/04/5004c379698f470eef17444fb053ab76d0e1c5a98d8dbc8658f528b3e446b6c6.png)
Historical Evolution of Lifespan
![Life expectancy at age 65 years[2] 22.5 20 17.5 15 12.5](/images/05/da/05dafa58cd57da8fb8e7e8f29aa46ac67e8917d6e037433846b83761aaae2ec5.png)
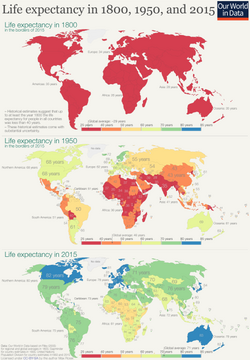
For the vast majority of human history, life expectancy remained low due to plagues, wars, accidents, and the lack of modern medicine. In the early Bronze Age, LEB was estimated at 24 years. In Ancient Rome and Greece, while many died in childhood, those who reached age 30 often had a reasonable chance of reaching 50 or 60.
The transition toward longer lives accelerated in the 19th and 20th centuries. By the 1840s, countries like Norway, Sweden, and Denmark began surpassing the 40-year mark. The most dramatic increases occurred after 1900, driven by sanitation, vaccinations, and antibiotics.
| Era/Period | Estimated LEB (Years) | Key Notes |
|---|---|---|
| Paleolithic/Neolithic | 20–33 | High infant and childhood mortality |
| Classical Greece/Rome | 20–33 | Survival to age 10 often meant another 40 years of life |
| Early Middle Ages (Europe) | 30–35 | Significant variation by social rank |
| 19th Century World Average | 28.5–32 | Industrialization beginning to impact health |
| 1950 World Average | 45.7–48 | Post-WWII medical advancements |
| 2019–2020 World Average | 72.6–73.2 | Modern public health and medicine |
Regional and Demographic Variations
![Life expectancy at age 80 years[2] 10 7.5 5](/images/69/9b/699b5536c45819278c8f728aef79a532f0ff45a024d73a96f903c1b1093ead0d.png)
Global Disparities
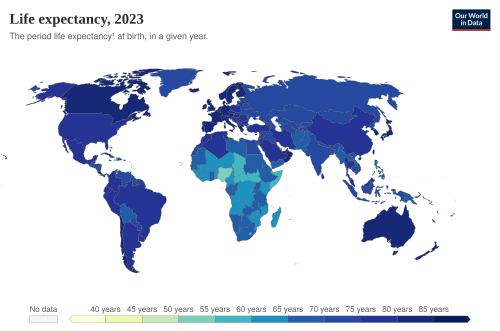
Life expectancy varies wildly by geography. While Hong Kong has seen LEB reach 85.3 years, the Central African Republic has seen figures as low as 54. In Africa, the HIV/AIDS pandemic caused severe declines in the 1990s. UN projections suggest that without HIV/AIDS, countries like Botswana and Zimbabwe would have had life expectancies near 70 years instead of the low 30s during the peak of the crisis.
![Graphs of life expectancy at birth for some sub-Saharan countries showing the fall in the 1990s primarily due to the HIV pandemic[65]](/images/aa/ec/aaec3d747632b5eb58462af3c224a221107415f01b719632513f830742aaa98c.webp)
The United States Experience
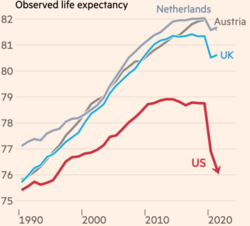
The US has faced a "life expectancy crisis," with millions of "missing Americans"—deaths that could have been avoided if the US had the mortality rates of other wealthy nations. There are also significant ethnic disparities: Asian American women have the highest life expectancy (85.8 years), followed by Hispanic Americans (81.2 years), while Black Americans have historically had shorter lifespans than White Americans, though this gap has narrowed since 1993.
Socioeconomic and Lifestyle Factors
Wealth does not always guarantee longevity. A study of Chinese emperors found their average life expectancy was only 41.3 years, significantly lower than that of Buddhist monks (66.9 years) or traditional doctors (75.1 years). Education also plays a critical role; in the US, those who did not complete high school have a mortality rate four times higher than those with at least 16 years of education.
![Life expectancy vs healthcare spending of rich OECD countries. US average of $10,447 in 2018.[82]](/images/49/36/4936a93376b97c0af962f806e5e9affc030eda74bb200f79a40980aabb6e4be9.jpg)
Biological and Health Determinants
Gender Differences
Women generally outlive men globally. While some research suggests female fetuses may have higher mortality rates, females have higher survival rates among the smallest premature babies. By the time a population reaches age 110, approximately 90% of survivors are female.
![Pink: Countries where female life expectancy at birth is higher than males. Blue (excluding oceans): A few countries in southern Africa where females have shorter lives due to AIDS. (2015)[90]](/images/04/42/044270c3142bd3e6ce96c9defcbd4d3ccdbfb440751a17194832941dbcc2cd58.jpg)
Medical Conditions and Genetics
Chronic illnesses significantly reduce life expectancy. Diabetes can reduce lifespan by 10 to 20 years, and Alzheimer's disease in patients over 60 often results in a remaining life expectancy of only 3 to 10 years. Additionally, those with serious mental illnesses often experience much shorter lives than the general population.
![Life expectancy in the seriously mentally ill is much shorter than the general population.[120]](/images/33/bf/33bfd3dc7ba4f7a6907f3dfdd21389e3aa8c5699b122c2f7fd0bcf630d80d634.png)
Healthy Life Expectancy (HALE)
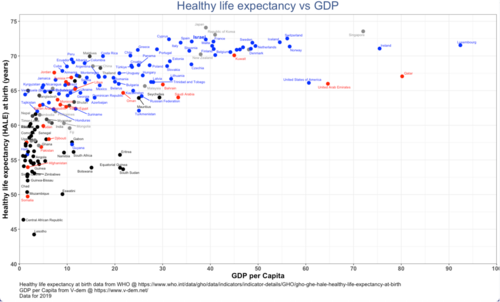
Distinguishing between total lifespan and Healthy Life Expectancy (HALE) is vital. HALE measures the number of years a person can expect to live in "full health," excluding years lived with disability or disease. This metric is often used to evaluate the quality of life and the effectiveness of healthcare systems relative to GDP.
Frequently Asked Questions
![Life expectancy and healthy life expectancy by sex in 2019[1]](/images/e5/fe/e5fe398e9e3b3360834aaffc86b7eb10d1f0bd51c174c9d2a4a4d64b7d2a53ae.png)
!["Healthspan, parental lifespan, and longevity are highly genetically correlated."[112]](/images/06/28/0628571acb5d4fb20eb310a0d13c818ff77a2508167e75687cdeeb73aba9024e.png)
!["Remaining" life expectancy—expected number of remaining years of life as a function of current age—is used in retirement income planning.[174]](/images/bc/b9/bcb9f32064098ca366219b7bc71c4442d1ab5d60b5a40028357f419b7af747de.webp)
![Life expectancy[174] increases with age already achieved.](/images/22/0d/220d2ff678d7b455996dd8d54ceb745c0ff6e2b016ee41cabbfb82ffd4f14a9d.webp)
Why was life expectancy so low in the past?
Low historical life expectancy was primarily driven by high infant and child mortality. Many people died from epidemics, plagues, and childbirth before the age of five. Those who survived childhood often lived into their 50s or 60s.
Does a life expectancy of 30 mean people died at 30?
No. Life expectancy is an average. In a population with an LEB of 30, many people died in infancy, while others lived to be 60 or 70. The high number of early deaths pulls the mathematical average down.
How does education affect how long we live?
Education is strongly correlated with longevity. In the US, individuals with higher education levels (16+ years) have significantly lower mortality rates than those who did not complete high school, likely due to better access to healthcare and healthier lifestyle choices.
What is the difference between life expectancy and lifespan?
Lifespan refers to the maximum number of years an individual or species can possibly live, whereas life expectancy is a statistical average of how long a person is expected to live based on current data.
Why do women generally live longer than men?
While the exact reasons are complex, data shows a consistent gap where women outlive men in most countries. This is attributed to a combination of biological advantages and differences in risk-taking behaviors and mortality rates in young adulthood.