Human Development Index: Measuring Global Progress Beyond Economics
For decades, the success of a nation was measured almost exclusively by its economic output. However, the introduction of the Human Development Index (HDI) in 1990 shifted this paradigm, arguing that people and their capabilities should be the ultimate measure of development. By combining health, education, and standard of living, the HDI provides a more holistic view of how countries are faring in improving the lives of their citizens.
The index is published by the United Nations Development Programme (UNDP) and has become the most widely used indicator of human development globally, challenging the reliance on purely economic metrics like Gross Domestic Product (GDP).
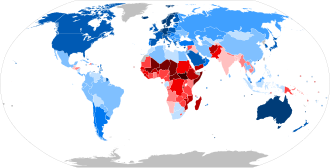
Key Facts
- Three Dimensions: The HDI measures a long and healthy life, knowledge, and a decent standard of living.
- Calculation: It is the geometric mean (the cube root of the product) of three individual indices: health, education, and income.
- Coverage: Data is available for 192 countries and one territory.
- Classification: Scores are categorized as Very High (≥ 0.800), High (0.700–0.799), Medium (0.550–0.699), and Low (< 0.550).
- Data Sources: Information is primarily gathered from UN agencies, the World Bank, IMF, and OECD.
How the HDI is Calculated
To arrive at a single score, the UNDP uses specific indicators to quantify performance across three core dimensions. Each dimension is converted into an index with a value between 0 and 1.
1. Long and Healthy Life
This dimension is measured by life expectancy at birth, which serves as a proxy for the overall health and nutrition of a population.
2. Knowledge
Education is measured using two distinct indicators: expected years of schooling for children entering the system and mean years of schooling for adults.
3. Decent Standard of Living
This is quantified using Gross National Income (GNI) per capita, adjusted for Purchasing Power Parity (PPP $), to account for the cost of living and inflation differences between countries.
Because the HDI uses a geometric mean rather than a simple average, a poor performance in one dimension cannot be fully offset by a high performance in another, ensuring a more balanced representation of development.
| Dimension | Indicators | Dimension Index |
|---|---|---|
| Long and healthy life | Life expectancy at birth | Life expectancy index |
| Knowledge | Expected years of schooling; Mean years of schooling | Education index |
| Decent standard of living | GNI per capita (PPP $) | GNI index |
Evolution and Specialized Indices
While influential, the HDI has faced criticism for oversimplifying complex national realities into a single number and omitting critical factors like gender and wealth distribution. In response, several specialized versions of the index have been developed.
- Inequality-adjusted HDI (IHDI): Introduced in 2010 to account for how development is distributed across a population.
- Gender Development Index (GDI): Introduced in 1995 to highlight disparities between men and women.
- Subnational HDI (SHDI): Launched in 2018 by the Global Data Lab at Radboud University, providing data for over 1,600 regions to show internal disparities within a single country.
- Planetary Pressures-adjusted HDI (PHDI): Introduced in 2020, this index penalizes countries with a higher ecological footprint, linking human progress to environmental sustainability.
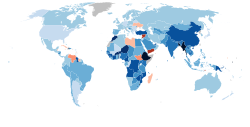
Scope and Data Limitations
The Human Development Report includes data for all 193 UN member states, as well as Hong Kong and Palestine. However, the full HDI is not calculated for Monaco and North Korea, though some components are available. Certain entities, such as the Cook Islands, Niue, and the Holy See (Vatican City), are excluded from the report entirely.
It is important to note that HDI values are not always comparable across different report years. Because the UNDP frequently updates its methodology and improves data quality, each new report often recalculates the HDI for previous years to maintain consistency.
Frequently Asked Questions
What is the difference between GDP and HDI?
GDP (Gross Domestic Product) measures only the economic output of a country. HDI is a broader measure that includes GDP (via GNI per capita) but also incorporates health and education to provide a more complete picture of human well-being.
Why is the geometric mean used instead of an arithmetic mean?
The geometric mean prevents a very high score in one category (like income) from masking a very low score in another (like health), requiring a country to perform reasonably well across all three dimensions to achieve a high overall score.
Which countries are not included in the HDI?
The Cook Islands, Niue, and the Holy See (Vatican City) are not included in the report. Additionally, while Monaco and North Korea are UN member states, the full HDI is not calculated for them.
What does a "Very High" HDI score mean?
A score of 0.800 or above is classified as "Very High," indicating that the country has achieved high levels of life expectancy, education, and income per capita.
How does the PHDI differ from the standard HDI?
The Planetary Pressures-adjusted HDI (PHDI) adjusts a country's score based on its ecological footprint, meaning countries that achieve high development at a high environmental cost see their scores decrease.