Corruption Perceptions Index: Measuring Global Public Sector Integrity
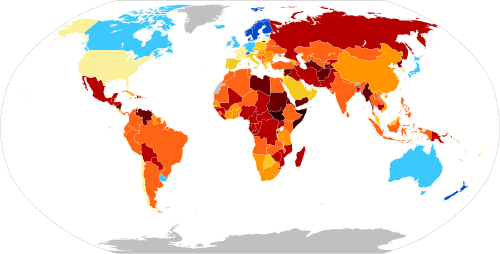
The Corruption Perceptions Index (CPI) is a globally recognized benchmark published annually by Transparency International, a German-registered association. Since its inception in 1995, the CPI has served as a critical tool for scoring and ranking countries based on the perceived levels of public sector corruption. By aggregating the views of experts and business executives, the index defines corruption as the "abuse of entrusted power for private gain."
While the index originally used a scale of 10 to 0 between 1995 and 2011, it transitioned in 2012 to a scale of 0 to 100. In this current system, a score of 100 represents a country perceived as very clean, while 0 indicates a highly corrupt environment.
Key Facts
- Scope: Focuses exclusively on public sector corruption.
- 2025 Top Scorers: Denmark (89), Finland (88), and Singapore (84).
- 2025 Lowest Scorers: South Sudan (9), Somalia (9), and Venezuela (10).
- Data Sources: Utilizes 13 different surveys and assessments from 12 independent institutions.
- Economic Link: Research suggests a correlation between higher CPI scores and increased long-term GDP growth.
CPI Methodology and Data Selection
To ensure consistent comparisons across different years and nations, the CPI employs a rigorous four-stage methodology: selecting data sources, rescaling them to a uniform scale, aggregating the results, and estimating uncertainty.
Source Data Selection
The index captures assessments of various corrupt practices, including bribery (offering or receiving illicit payments), misuse of public funds, nepotism in the civil service, and state capture (where private interests significantly influence a state's decision-making processes). To be included in the ranking, a country must be evaluated by at least three different sources.
The 12 institutions providing data include the World Bank, World Economic Forum, Freedom House, the Economist Intelligence Unit, and the World Justice Project, among others.
Rescaling and Standardization
Because different sources use different metrics, Transparency International standardizes all data points to a 0–100 scale. This process involves calculating the mean and standard deviation for each source based on a baseline year. Using the STATA statistical software package, the data is converted into a standardized z-score (centered around 0) before being converted back to a 0–100 scale with a mean of approximately 45. This ensures that scores remain comparable over time.
The Impact of Corruption on Economy and Justice
The CPI is more than a ranking; it is often used to analyze the broader health of a nation's socio-economic systems.
Economic Growth and Investment
Studies from 2007 and 2008 indicated that every unit increase in a country's CPI score correlated with a 1.7% increase in GDP growth. Furthermore, a power-law dependence was found linking higher transparency to increased rates of foreign investment. A 2020 study on Balkan countries confirmed that the CPI is a causal factor in GDP growth, with an affecting rate of 0.34.
Justice, Equality, and Environment
Transparency International has noted a strong correlation between the absence of discrimination and higher CPI scores. In highly corrupt nations, equal treatment before the law is rarely guaranteed, and impunity—where public officials are not sanctioned for failing to fulfill their responsibilities—is more common.
Beyond justice, other research has linked corruption to environmental and social issues. A 2001 study found a 0.75 correlation between the CPI and poor national environmental performance. Additionally, a 2013 study found a robust positive association between income inequality (measured by the Gini coefficient) and corruption.
Critical Perspectives and Limitations
Despite its influence, the CPI faces significant criticism from political scientists and economists. Critics argue that corruption is too complex to be captured by a single numerical score and that measuring perceptions rather than actual corruption can reinforce existing stereotypes.
A major limitation is the index's exclusive focus on the public sector. This means high-profile private sector scandals, such as the Libor scandal or the Volkswagen emissions case, are not reflected in the scores. Furthermore, a high domestic score does not guarantee a lack of international corruption; for example, Sweden ranked 3rd in 2015 while its state-owned company, TeliaSonera, faced bribery allegations in Uzbekistan.
Global Trends and 2025 Outlook
Recent data suggests that global corruption levels are stagnating. In the 2023 report, only 28 of 180 countries showed improvement over twelve years, while 34 worsened. Over 80% of the global population lives in countries with a score below the global average of 43.
| Perception Level | Score Range |
|---|---|
| Very Clean / Less Corrupt | 90–100 |
| High Transparency | 80–89 |
| Moderate Transparency | 50–79 |
| Low Transparency | 30–49 |
| Highly Corrupt | 0–29 |
Frequently Asked Questions
What exactly does the Corruption Perceptions Index measure?
The CPI measures the perceived levels of public sector corruption in various countries. It does not measure actual recorded instances of corruption but rather the opinions of experts and business leaders.
Why does the CPI only focus on the public sector?
The index is designed to assess the integrity of government institutions and the abuse of entrusted public power. Consequently, it ignores corruption within the private sector.
How is a CPI score calculated?
The score is an aggregate of 13 different surveys and assessments from 12 institutions. These data points are rescaled to a 0–100 scale and then averaged to produce the final country score.
Does a high CPI score mean a country is completely free of corruption?
Not necessarily. A high score indicates a perception of low domestic public sector corruption, but it does not account for private sector corruption or bribery committed by that country's nationals or companies abroad.
What is the relationship between the CPI and GDP?
Multiple studies indicate a positive correlation, suggesting that countries with higher transparency (higher CPI scores) tend to experience higher long-term economic growth and more foreign investment.