Understanding Climate: Patterns, Classifications, and Change
A common saying in meteorology is, "Climate is what you expect, weather is what you get." While weather describes the immediate conditions of the atmosphere—such as a sudden rainstorm or a sunny afternoon—climate refers to the long-term patterns of these conditions. To understand climate, scientists look at the mean and variability of meteorological variables, such as temperature, humidity, atmospheric pressure, wind, and precipitation, typically averaged over a period of 30 years.
Climate is not just about the air we breathe; it is a complex system involving the interactions between the atmosphere, the hydrosphere (water), the cryosphere (ice), the lithosphere (land), and the biosphere (living organisms). Many factors determine the climate of a specific location, including its latitude, altitude, terrain, land use, and proximity to large bodies of water and their currents.
Climate Classification Systems
Because the Earth contains a vast array of environments, scientists use classification systems to categorize different climate regimes. These systems help researchers understand how climate influences the biological life—or biomes—within a region. There are two main approaches to classification: genetic methods, which focus on the causes of climate, and empiric methods, which focus on the observable effects of climate.
The most widely used method is the Köppen climate classification, which categorizes regions based on temperature and precipitation patterns. Another significant system is the Thornthwaite system, which has been used since 1948. Unlike simpler models, the Thornthwaite system incorporates evapotranspiration—the process by which water is transferred from the land to the atmosphere through soil evaporation and plant transpiration—to study how climate affects biological diversity. This system identifies major classifications such as microthermal, mesothermal, and megathermal climates.
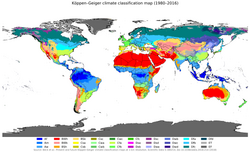
Other systems, such as the Bergeron and Spatial Synoptic Classification systems, take a genetic approach by focusing on the origin of the air masses that define a region's climate.
| Classification System | Primary Focus | Key Characteristic |
|---|---|---|
| Köppen | Temperature and precipitation | Most widely used; correlates with biomes |
| Thornthwaite | Biological diversity | Incorporates evapotranspiration data |
| Bergeron & Spatial Synoptic | Air mass origins | Focuses on the causes of climate regimes |
The Study of Past and Present Climates
Paleoclimatology: Reading the Earth's History
To understand how the climate has changed over millions of years, scientists practice paleoclimatology. Because direct weather observations only date back a few centuries, paleoclimatologists must rely on proxy variables. These are indirect pieces of evidence, such as ice cores, lake sediments, tree rings, and coral, which act as natural records of past environmental conditions.
Modern Climate Records
In the modern era, we rely on precise instruments like thermometers, barometers, and anemometers. Since the 1960s, the launch of satellites has revolutionized this field, allowing for global-scale data collection in remote areas like the Arctic and the open oceans. This modern data helps climatologists establish climate normals—30-year arithmetic averages used as reference points to compare current trends against the past.
![Surface air temperature change over the past 50 years.[30]](/images/93/0d/930dd963e3a21e4768f7d8c6f4f9e6b1fdce4ee083a37be19f846ab0c3194e73.webp)
Climate Variability and Global Change
It is important to distinguish between climate variability and climate change. Variability refers to natural fluctuations in the climate system, such as periodic oscillations or random "noise." These can be driven by astronomical factors like solar variation or internal processes like ocean-atmosphere heat distribution.
Climate change, however, refers to long-term variations in the average state of the atmosphere. While Earth has undergone natural shifts in the past—including four major ice ages driven by orbital changes and volcanic activity—recent warming is distinct. This modern era of global warming is primarily driven by human activities, specifically the emission of greenhouse gases like carbon dioxide and methane.
The impact of these changes is significant. For instance, climate scientist Lesley Ann Hughes noted that a 3 °C (5 °F) change in mean annual temperature can cause isotherms (lines on a map connecting points of equal temperature) to shift by 300–400 km in latitude or 500 m in elevation. This forces species to migrate toward the poles or higher altitudes to survive.
![Observed temperature[31] vs the 1850–1900 average used by the IPCC as a pre-industrial baseline.[32] The primary driver for increased global temperatures in the industrial era is human activity, with natural forces adding variability.[33]](/images/c9/f3/c9f374c625f0fd2ab855bace7248a3187fdf6090717cbe1afde489d009d661fa.webp)
Recent data from the EU's Copernicus Climate Change Service indicates that average global air temperature passed the 1.5°C warming threshold during the period from February 2023 to January 2024.
How Climate Models Predict the Future
To project future conditions, scientists use climate models. These are complex mathematical simulations that use physics equations to represent the transfer of energy between the atmosphere, oceans, land, and ice. A fundamental concept in these models is the balance between incoming short-wave radiation from the sun and outgoing long-wave infrared radiation from the Earth. Any imbalance in this energy exchange results in a change in the planet's average temperature.
These models vary in complexity and resolution. While simple models might treat the Earth as a single point, highly complex "coupled" models simulate the intricate interactions between the atmosphere and the oceans. These tools are essential for predicting how increasing greenhouse gases will continue to drive upward trends in global surface temperatures, particularly in the higher latitudes of the Northern Hemisphere.
Key Facts
- Standard Period: The World Meteorological Organization (WMO) uses a 30-year average to define climate normals.
- Primary Drivers: While natural cycles exist, recent global warming is primarily caused by human-driven greenhouse gas emissions.
- Proxy Evidence: Scientists use tree rings, ice cores, and coral to reconstruct ancient climates.
- Climate vs. Weather: Weather is short-term atmospheric behavior; climate is the long-term statistical average.
- Energy Imbalance: The Earth's Energy Imbalance (EEI) is a critical metric used to track the status of global change.
Frequently Asked Questions
What is the difference between weather and climate?
Weather refers to short-term atmospheric conditions, such as daily temperature or rainfall. Climate is the long-term average of those weather patterns, typically measured over a 30-year period.
How do scientists know what the climate was like thousands of years ago?
Since direct measurements didn't exist, scientists use "proxies." These are natural records like ice cores, tree rings, and sediment layers that preserve physical and chemical evidence of past temperatures and precipitation.
What is the Köppen climate classification?
It is the most widely used system for categorizing the world's climates. It groups regions based on their typical temperature and precipitation patterns, which often correspond to specific biological biomes.
Why is a 30-year period used to define climate?
A 30-year period is long enough to filter out short-term anomalies, such as El Niño events, but short enough to reflect meaningful, long-term climatic trends.
What are climate models used for?
Climate models use physics-based mathematical equations to simulate the Earth's climate system. They are used to study weather dynamics, understand past climates, and project future climate scenarios based on different greenhouse gas levels.