2000 United States Census: Population Trends and Demographic Shifts
Conducted by the Census Bureau, the 2000 United States census was the twenty-second federal count of the nation's residents. As of April 1, 2000, the resident population of the United States was determined to be 281,421,906. This figure represented a 13.2% increase over the 248,709,873 people enumerated during the 1990 census. At the time, it stood as the largest civilly administered peacetime effort in the history of the United States.
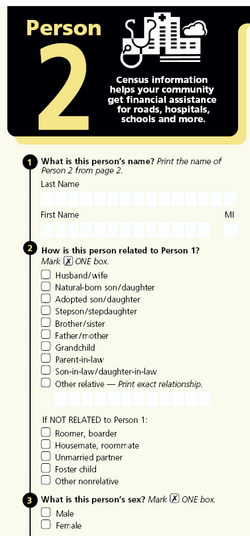
One of the most significant procedural aspects of this count was the use of the "long form," a detailed questionnaire containing over 100 questions sent to approximately 16% of households. This marked the final time the long form was used in a decennial census; starting in 2010, the Bureau transitioned to a "short form" only model, moving detailed data collection to the American Community Survey.
Key Facts
- Total Population: 281,421,906 (a 13.2% increase from 1990).
- Most Populous State: California (33,871,648).
- Least Populous State: Wyoming (493,782).
- Fastest Growing State: Nevada (66.3% increase).
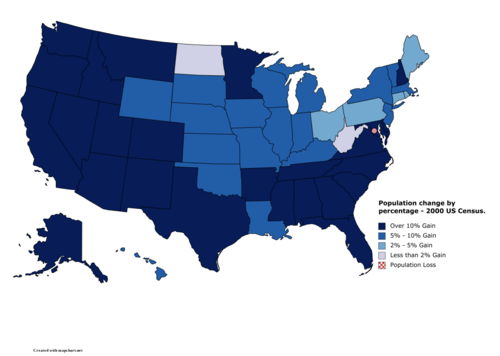
- Regional Growth: The South and West saw the highest increases, shifting the mean center of the U.S. population to Phelps County, Missouri.
- Historic First: The 2000 census was the first to provide survey options for multiracial Americans.
Population Profile and Demographics
The 2000 census provided a comprehensive snapshot of the American people, including the 50 states, the District of Columbia, and the territory of Puerto Rico (which had a population of 3,808,610, an 8.1% increase). The data revealed a diversifying nation with shifting age and ethnic profiles.
Ethnic and Racial Composition
- White/Caucasian: 75% of respondents identified as White or Caucasian and no other race.
- Hispanic: Accounted for 12.5% of the population, rising from 9% in 1990.
- Black or African American: 12.3% of the population.
- Asian: 3.6% of respondents.
- Multiracial: 2.4% (6.8 million people) identified as two or more races.
- German Descent: 12.4% (34.5 million people) reported German ancestry.
Age and Socioeconomic Trends
The census highlighted a significant aging trend in the U.S. population. Between 1990 and 2000, the population aged 45 to 54 grew by 49%, while those aged 85 and older grew by 38%. Notably, women outnumbered men two to one in the 85+ age bracket.
Economically, median household incomes rose for both families and non-families since 1993, with the fastest growth seen in households headed by a woman without a spouse. The data also indicated that married-couple families experienced the lowest poverty rates, while those living in poverty were more likely to lack health insurance.
State and City Rankings
The population distribution showed a clear trend toward the Sun Belt. While California remained the most populous state, states like Nevada, Arizona, and Florida saw explosive growth.
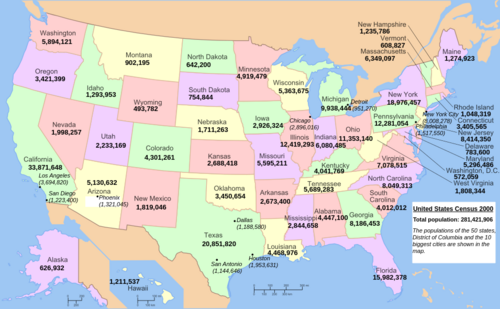
In urban centers, New York City remained the largest city by a wide margin, followed by Los Angeles and Chicago. The top ten cities reflected a concentration of population in the Northeast, West, Midwest, and South.
| Rank | State | Population | Percent Change (since 1990) |
|---|---|---|---|
| 1 | California | 33,871,648 | 13.8% |
| 2 | Texas | 20,851,820 | 22.8% |
| 3 | New York | 18,976,457 | 5.5% |
| 4 | Florida | 15,982,378 | 23.5% |
| 5 | Illinois | 12,419,293 | 8.6% |
| 6 | Pennsylvania | 12,281,054 | 3.4% |
| 7 | Ohio | 11,353,140 | 4.7% |
| 8 | Michigan | 9,938,444 | 6.9% |
| 9 | New Jersey | 8,414,350 | 8.9% |
| 10 | Georgia | 8,186,453 | 26.4% |
Reapportionment and Legal Controversies
The primary purpose of the decennial census is reapportionment—the process of determining how many seats each state receives in the U.S. House of Representatives. Based on the 435 available seats, each member of the House in 2000 represented approximately 647,000 people.
The Adjustment Debate
Leading up to the 2000 count, a controversy arose regarding whether the Bureau should adjust figures based on a post-enumeration survey. In 1999, the Supreme Court ruled 5–4 that the Constitution prohibits using such adjusted figures for apportionment, though they may be used for other purposes.
The Utah Challenge
Utah narrowly missed gaining a fourth congressional seat, falling short by 857 people (a margin later reduced to 80 after an overcount in North Carolina was discovered). Utah argued that religious missionaries serving abroad should be counted as residents of their home state. However, the Supreme Court affirmed a lower court ruling in 2002, rejecting Utah's effort to include these missionaries in the count.
Frequently Asked Questions
What was the total population of the U.S. in 2000?
The total resident population was 281,421,906, which was a 13.2% increase from the 1990 census.
What is the "long form" and why is it no longer used?
The long form was a detailed census questionnaire with over 100 questions sent to a sample of the population (16% in 2000). It was replaced by the American Community Survey to allow for more frequent and detailed data collection without burdening every household every ten years.
How does the census affect the House of Representatives?
The census results are used for reapportionment, which redistributes the 435 seats in the U.S. House of Representatives among the states based on their resident population.
Which state had the highest percentage of population growth?
Nevada experienced the highest percentage of growth among the states, with an increase of 66.3%.
When will personally identifiable information from the 2000 census be released?
Personally identifiable information from the 2000 census is scheduled to be available in the year 2072.