1920 United States Census: A Turning Point in American Demographics
The 1920 United States census, conducted by the Census Bureau over a one-month period starting January 5, 1920, captured a nation in the midst of a profound transformation. This fourteenth national enumeration served as a snapshot of the country as of January 1, 1920, recording the status of residents even if their circumstances changed during the actual counting process.
This specific census is historically significant for several reasons: it was the first time the U.S. population surpassed the 100 million mark, and it documented a pivotal shift in where Americans lived and how they identified.
Key Facts
- Total Population: 106,021,537, representing a 15.0% increase from 1910.
- Urban Milestone: For the first time, over 50% of the U.S. population lived in urban areas.
- State Extremes: New York was the most populous state (over 10 million), while Nevada was the least populous.
- Political Deadlock: Congressional failure to agree on a reapportionment plan meant 1910 seat distributions remained until 1933.
The Great Urban Shift
One of the most striking revelations of the 1920 census was the transition from a rural to an urban society. To standardize this measurement, the Census Bureau had previously established a minimum population threshold of 2,500 for a location to be categorized as an urban place. This definition included all territory, persons, and housing units within an incorporated area meeting that threshold.
The 1920 results confirmed that the majority of the American population had moved into these urban centers, signaling a fundamental change in the nation's economic and social structure.
Population Distribution and State Rankings
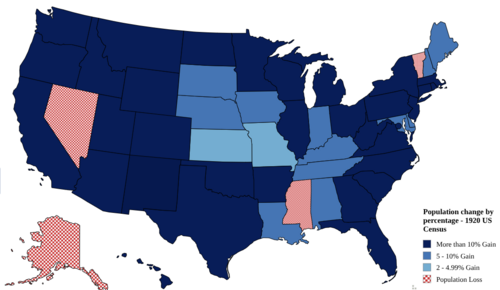
The census highlighted massive growth in several states, particularly in the West. While New York remained the most populous state, recording 10,385,227 residents, states like Arizona saw explosive growth of 63.5% compared to the 1910 figures.
Conversely, some regions experienced decline. Nevada, the least populous state with 77,407 residents, saw a population decrease of 5.5%.
| Rank | State | 1920 Population | 1910 Population | Percent Change |
|---|---|---|---|---|
| 1 | New York | 10,385,227 | 9,113,614 | 14.0% |
| 2 | Pennsylvania | 8,720,017 | 7,665,111 | 13.8% |
| 3 | Illinois | 6,485,280 | 5,638,591 | 15.0% |
| 4 | Ohio | 5,759,394 | 4,767,121 | 20.8% |
| 5 | Texas | 4,663,228 | 3,896,542 | 19.7% |
| 6 | Massachusetts | 3,852,356 | 3,366,416 | 14.4% |
| 7 | Michigan | 3,668,412 | 2,810,173 | 30.5% |
| 8 | California | 3,426,865 | 2,377,549 | 44.1% |
| 9 | Missouri | 3,404,055 | 3,293,335 | 3.4% |
| 10 | New Jersey | 3,155,900 | 2,537,167 | 24.4% |
Census Methodology and Data Collection
The 1920 census was comprehensive, gathering detailed socio-economic data to help the government understand the makeup of the citizenry. Enumerators collected information on:
- Personal Details: Age, marital status, and literacy.
- Immigration: Year of immigration, naturalization status, mother tongue, and English speaking ability.
- Employment: Occupation, industry, and class of worker.
- Housing: Whether the home was owned or rented, and if owned, whether it was mortgaged.
- Education: School attendance.
Political Implications and Reapportionment
Under the U.S. Constitution, House seats must be reapportioned every ten years based on census data. However, following the 1920 census, Congress failed to agree on a new plan. As a result, the seat distribution from the 1910 census remained in effect for over two decades, until 1933. This deadlock eventually led to the Reapportionment Act of 1929, which capped the number of representatives at 435 and established a permanent method for reapportionment.
Data Availability and Preservation
The original paper enumeration sheets from 1920 were microfilmed in the 1940s and subsequently destroyed. Today, researchers can access these records through the National Archives and Records Administration (NARA). Additionally, microdata is available via the Integrated Public Use Microdata Series (IPUMS), and aggregate data can be found through the National Historical Geographic Information System.
Frequently Asked Questions
What was the total population of the U.S. in 1920?
The total resident population was determined to be 106,021,537, which was a 15.0% increase over the 1910 census.
Which state had the largest population in 1920?
New York was the most populous state, with 10,385,227 residents, making it the first state to ever record a population exceeding ten million.
Why was the 1920 census significant for urban studies?
It marked the first time in U.S. history that more than 50 percent of the population was classified as living in an urban area (defined as an incorporated area with at least 2,500 people).
What happened to the House of Representatives seats after this census?
Due to a lack of agreement in Congress, the reapportionment of House seats did not occur. The 1910 distribution remained in place until 1933, eventually leading to the Reapportionment Act of 1929.
How can I access the original 1920 census records today?
Since the original sheets were destroyed after being microfilmed, records are available through the National Archives and Records Administration, IPUMS, and the National Historical Geographic Information System.