Student's t-test: A Comprehensive Guide to Statistical Significance
In the world of data analysis, determining whether a difference between two groups is a genuine phenomenon or merely a result of random chance is a fundamental challenge. The Student's t-test is a powerful statistical tool designed to address this exact question. By evaluating whether the means of different populations are significantly different, this test provides researchers with a mathematical framework to validate their findings.
At its core, a t-test is a type of statistical hypothesis test. It operates under the assumption that the test statistic follows a t-distribution under the null hypothesis. While a Z-test is often used for large datasets, the t-test is specifically indispensable when the scaling term (often related to the standard deviation) is unknown and must be estimated from the data itself. As sample sizes increase, the results of a t-test typically converge toward those of a Z-test.

William Sealy Gosset, who developed the "t-statistic" and published it under the pseudonym of "Student"
Key Facts
- Primary Use: Testing whether the means of two populations are significantly different.
- Core Assumption: The test statistic follows a Student's t-distribution when the scaling term is estimated from the data.
- Historical Origin: Developed by William Sealy Gosset at the Guinness Brewery under the pseudonym "Student."
- Convergence: As sample size increases, the t-test results approach those of a Z-test.
- Decision Metric: A p-value below a chosen threshold (e.g., 0.05) typically leads to rejecting the null hypothesis.
The History of the t-test
The origins of the t-test are as much about industrial secrecy as they are about mathematics. While the t-distribution was first derived in 1876 by Helmert and Lüroth, and later appeared in Karl Pearson's work in 1895, it was William Sealy Gosset who brought it to prominence.
Working at the Guinness Brewery in Dublin, Ireland, Gosset faced a specific problem: analyzing small sample sizes, such as the chemical properties of barley. Because Guinness did not want competitors to know how they were monitoring raw material quality, they required staff to use pen names. Consequently, Gosset published his findings in the journal Biometrika in 1908 using the pseudonym "Student." It was later through the work of Ronald Fisher that the method became widely recognized as "Student's t-test."
ภาพประกอบจากบทความต้นฉบับ
Types of t-tests
Depending on the structure of your data and the relationship between your groups, different versions of the t-test are applied:
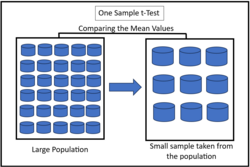
One-sample t-test
This version is used to determine whether the mean of a single sample differs significantly from a known or hypothesized population mean.
Two-sample t-tests
This category is used to compare the means of two different groups. It is subdivided into two main types:
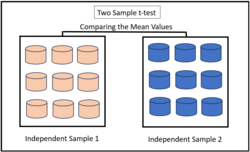
Independent (unpaired) samplesThe independent samples t-test is used when you have two separate, unrelated sets of data. For example, if you randomly assign 50 subjects to a treatment group and 50 different subjects to a control group to test a medical treatment, you are working with independent samples.
ภาพประกอบจากบทความต้นฉบับ
Paired samplesThe paired t-test (or dependent t-test) is used when the two sets of observations are related. This often occurs in repeated measures, where the same subjects are tested twice (e.g., before and after a treatment), or in matched pairs, where subjects are paired based on specific characteristics like age.
Mathematical Assumptions and Calculations
To ensure the results of a t-test are valid, several assumptions must be met. For independent samples, these include:
- The data should be normally distributed (often supported by the Central Limit Theorem in larger samples).
- The observations must be independent.
- The variance within the groups should be considered (tests exist for both equal and unequal variances).
Once the t-value and degrees of freedom are calculated, researchers determine a p-value. If this p-value falls below a pre-set significance level—commonly 0.10, 0.05, or 0.01—the null hypothesis is rejected in favor of the alternative hypothesis.
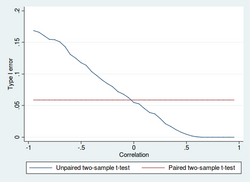
Type I error of unpaired and paired two-sample t-tests as a function of the correlation. The simulated random numbers originate from a bivariate normal distribution with a variance of 1. The significance level is 5% and the number of cases is 60.
Power and Sample Size
A critical aspect of experimental design is statistical power—the probability of correctly rejecting a null hypothesis when it is false. Power is influenced by several factors:
- The difference between the means of the two groups.
- The within-group standard deviation.
- The sample size (number of subjects).
- The significance level (alpha).
To simplify these relationships, researchers often use the standardized effect size, calculated by dividing the difference between means by the within-group standard deviation. A larger effect size or a larger sample size will generally increase the power of the test.
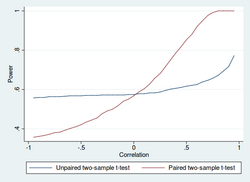
Power of unpaired and paired two-sample t-tests as a function of the correlation. The simulated random numbers originate from a bivariate normal distribution with a variance of 1 and a deviation of the expected value of 0.4. The significance level is 5% and the number of cases is 60.
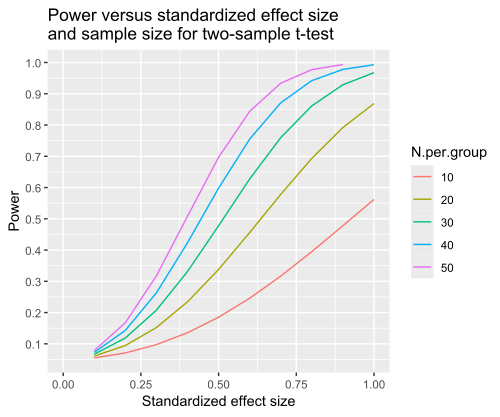
Graph showing power of a two-sample t-test versus standardized effect size and sample size
Summary of t-test Applications
| Test Type | Data Relationship | Typical Use Case |
|---|---|---|
| One-sample | Single group vs. known mean | Comparing a sample mean to a standard value. |
| Independent (Unpaired) | Two separate, unrelated groups | Comparing treatment vs. control groups. |
| Paired (Dependent) | Two related observations | Before-and-after studies on the same subjects. |
Frequently Asked Questions
What is the difference between a t-test and a Z-test?
A Z-test is used when the population variance is known and the sample size is large. A t-test is used when the population variance is unknown and must be estimated from the sample, making it more appropriate for smaller datasets.
What does a p-value tell me in a t-test?
The p-value indicates the probability of observing your results (or more extreme results) if the null hypothesis is true. A low p-value (typically < 0.05) suggests that the observed difference is statistically significant.
What happens if my two groups have unequal variances?
If the variances are significantly different, you should use a version of the t-test designed for unequal variances (such as Welch's t-test) to avoid inaccurate results.
How does sample size affect the t-test?
Increasing the sample size generally increases the statistical power of the test, making it easier to detect a true difference between groups if one exists.
Can a t-test be used for regression?
Yes, the two-sample t-test can be viewed as a special case of simple linear regression, where the t-score helps determine the significance of the slope of the regression line.