Chi-Squared Test: Principles, Applications, and Statistical Significance
In the world of statistical analysis, determining whether observed patterns are meaningful or merely the result of random chance is a fundamental challenge. The chi-squared test (also known as the chi-square or χ test) provides a robust framework for this task, particularly when analyzing contingency tables—tables used to display the frequency distribution of variables. This test is essential for examining whether two categorical variables are independent or if they influence one another.
Whether you are a researcher in biology or a data scientist in cryptography, understanding how to apply this test allows you to evaluate how well your observed data aligns with a theoretical model, known as the null hypothesis.
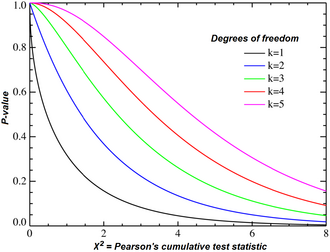
Key Facts
- Primary Use: Analyzing categorical variables in contingency tables to test for independence or goodness of fit.
- Core Requirement: Works best with large sample sizes where the test statistic approaches a chi-squared distribution.
- Null Hypothesis: Assumes there is no significant difference or relationship between the variables being studied.
- Alternative for Small Samples: Fisher's exact test is preferred when sample sizes are small.
- Key Limitation: Does not measure the strength of an association, only whether a relationship exists.
Foundations of the Chi-Squared Test
The chi-squared test is a statistical hypothesis test used to determine if there is a significant difference between the expected frequencies (what we would expect to see if the null hypothesis were true) and the observed frequencies (the actual data collected).
Pearson's Chi-Squared Test
Developed by Karl Pearson in 1900, this test is a cornerstone of modern statistics. Pearson investigated the "goodness of fit," proposing that as the number of observations (n) increases toward infinity, the distribution of the test statistic approaches the chi-squared distribution. This is particularly useful when observations are classified into mutually exclusive classes.
In standard applications, if the null hypothesis is true—meaning there are no differences between the classes in the population—the computed test statistic follows a χ frequency distribution. The goal is to evaluate the probability that the observed frequencies occurred by chance.
Yates's Correction for Continuity
Because the chi-squared distribution is continuous and the data from contingency tables are discrete, a slight error in approximation can occur. To mitigate this, Frank Yates suggested a correction for continuity. In a 2 × 2 contingency table, this involves subtracting 0.5 from the absolute difference between each observed and expected value, which reduces the chi-squared value and increases the resulting p-value.
Variations and Related Statistical Tests
While Pearson's test is the most common, different research scenarios require different mathematical approaches:
- Fisher's Exact Test: Used instead of the chi-squared test for 2 × 2 tables when sample sizes are too small to rely on asymptotic distributions.
- Binomial Test: An exact test used as an alternative to the 2 × 1 chi-squared goodness of fit test.
- McNemar's Test: Specifically designed for certain 2 × 2 tables involving paired observations.
- Likelihood-Ratio Tests: Used in general statistical modeling to determine if a more complex model is required over a simpler one.
Practical Applications
The versatility of the chi-squared test allows it to be applied across diverse scientific and technical fields:
Cryptanalysis
In the field of code-breaking, the test is used to compare the distribution of plaintext against decrypted ciphertext. A low chi-squared value indicates that the decryption was likely successful, as the distribution matches the expected patterns of natural language.
Bioinformatics
Researchers use the test to compare properties of genes, such as mutation rates or genomic content, across different categories like disease-related genes versus essential genes.Summary of Statistical Methods
| Test Name | Primary Use Case | Key Characteristic |
|---|---|---|
| Pearson's Chi-Squared | Large sample contingency tables | Tests goodness of fit and independence |
| Fisher's Exact Test | Small sample 2 × 2 tables | Provides an exact p-value |
| Binomial Test | 2 × 1 goodness of fit | Exact test for binomial distributions |
| McNemar's Test | Paired 2 × 2 tables | Analyzes changes in paired data |
Limitations and Considerations
Despite its utility, the chi-squared test has specific constraints that researchers must respect to avoid misleading conclusions:
- Independence Assumption: The test assumes all observations are independent. If data points are related, the results may be invalid.
- Sample Size Sensitivity: In very large samples, even tiny, practically irrelevant differences can appear statistically significant. Conversely, small samples may lack the power to detect real effects.
- Expected Frequencies: The test can become inaccurate if the expected frequency in any cell is very small (typically recommended to be at least 5).
- Lack of Effect Size: The test indicates if a relationship exists, but not how strong it is. Researchers should use measures like Cramér's V to report the strength of the association.
Frequently Asked Questions
What is the difference between independence and homogeneity tests?
In an independence test, you examine whether two variables are related within a single sample. In a homogeneity test, you examine whether different populations have the same proportions of a specific characteristic, even though the test is performed using the same mathematical method.
When should I use Fisher's exact test instead of chi-squared?
You should use Fisher's exact test when you are working with a 2 × 2 contingency table and the expected frequencies in the cells are very small, making the chi-squared approximation unreliable.
What does a high chi-squared value indicate?
A high chi-squared value suggests a large discrepancy between your observed data and the data you would expect under the null hypothesis. This often leads to rejecting the null hypothesis in favor of the alternative hypothesis.
Can the chi-squared test be used for continuous data?
No, the standard chi-squared test is designed for categorical (discrete) data. For continuous data, other tests like the t-test or ANOVA are typically more appropriate.
What are 'degrees of freedom' in a chi-squared test?
Degrees of freedom refer to the number of values in the final calculation that are free to vary. For a contingency table, it is generally calculated based on the number of rows and columns in the table.