Social Science Statistics: History, Methods, and Applications
Statistics serve as the backbone of quantitative social science, providing the tools necessary to transform complex human behaviors and societal trends into measurable data. By applying mathematical rigor to fields such as sociology, psychology, and economics, researchers can identify patterns that would otherwise remain invisible, allowing for a more objective understanding of the human experience.
The Evolution of Social Statistics
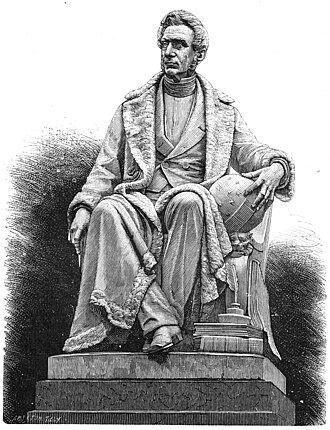
The application of statistics to human society began with the concept of social physics, championed by Adolph Quetelet. In his seminal work, Physique sociale, Quetelet analyzed distributions of human heights, marriage ages, and birth and death rates. He also introduced the Quetelet Index to quantify human characteristics.
As the field progressed, other pioneers refined the methodology. In 1885, Francis Ysidro Edgeworth utilized squares of differences to study fluctuations in vital statistics, while George Udny Yule explored the correlation between pauperism and out-relief in 1895. By 1897, Karl Pearson provided a numerical calibration for the fertility curve and integrated standard deviation, correlation, and skewness into the study of human populations.
The late 19th century also saw the emergence of the Pareto principle, derived from Vilfredo Pareto's 1897 analysis of income distribution in Great Britain and Ireland. Later, Louis Guttman introduced the Guttman scale, a method for representing ordinal variables (variables with a set order but no fixed distance between values) that facilitates the use of ordinary least squares techniques.
Macroeconomic Stylized Facts
In the realm of macroeconomics, statistical research has established several "stylized facts"—empirical regularities that describe economic behavior. Notable examples include:
- Bowley's law (1937): Observations regarding the proportion between wages and national output.
- The Phillips curve (1958): The observed relationship between wage levels and unemployment.
Statistical Methods in Social Sciences
Modern social scientists employ a diverse array of quantitative tools, ranging from research design and survey sampling to the Delphi method (a structured communication technique for forecasting). These tools are generally categorized by their mathematical foundation.
Covariance-Based Methods
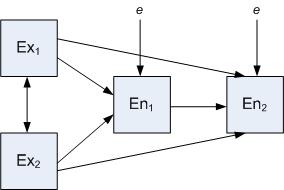
These methods focus on how variables change together. They include regression analysis, canonical correlation, factor analysis, and linear discriminant analysis. More complex frameworks include Path analysis and Structural Equation Modeling, which allow researchers to map complex causal relationships.
Probability and Distance-Based Methods
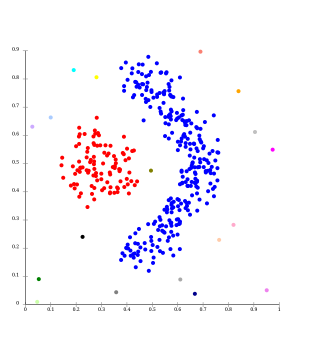
Probability-based methods, such as Bayesian statistics, Probit and Logit models, and Item Response Theory, deal with the likelihood of specific outcomes. Meanwhile, distance-based methods like Cluster analysis and multidimensional scaling group data points based on their similarity.
Categorical Data Analysis
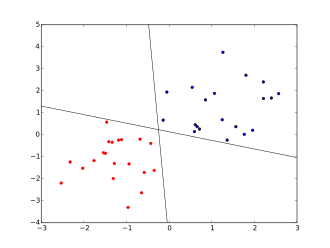
For data that falls into distinct categories, researchers use classification analysis and cohort analysis to track specific groups over time.
Practical Applications of Social Statistics
The utility of these methods extends across various sectors of public and private life. Social statistics are used to:
- Evaluate the quality of services provided to organizations or specific groups.
- Analyze human behavior within specific environments or special situations.
- Determine public needs and wants through statistical sampling.
- Manage economic factors, such as wage expenditures and savings.
- Improve workplace safety by preventing industrial accidents and diseases.
- Resolve labor disputes, as seen in the support provided to the Anthracite Coal Strike Commission of 1902-1903.
- Assist governments in strategic planning during times of peace and war.
| Category | Key Methods | Primary Use |
|---|---|---|
| Covariance-Based | Regression, Path Analysis, SEM | Analyzing relationships and causal paths |
| Probability-Based | Bayesian, Probit, Logit | Predicting likelihoods and stochastic processes |
| Distance-Based | Cluster Analysis, MDS | Grouping similar data points |
| Categorical | Classification, Cohort Analysis | Analyzing non-numerical group data |
Key Facts
- Adolph Quetelet pioneered "social physics," applying distributions to human traits.
- The Pareto principle originated from income distribution studies in 1897.
- Stylized facts like the Phillips curve provide empirical foundations for macroeconomics.
- Structural Equation Modeling and Path analysis are used for complex causal modeling.
- A fundamental rule in social science is that correlation does not imply causation.
Reliability and Debate
The rise of quantitative social science has led to the creation of specialized centers, such as Harvard's Institute for Quantitative Social Science, which emphasizes advanced causal models and Bayesian methods. However, the field is not without controversy.
Some experts argue that claims regarding "causal statistics" are overstated. There is ongoing debate about the reliability of certain practices, such as data dredging (searching through data to find patterns that can be presented as statistically significant), which can lead to biased policy conclusions. Critics warn that over-reliance on non-robust methods, like simple linear regression, can lead to an overestimation of a model's interpretive power.
Frequently Asked Questions
What is the difference between correlation and causation?
Correlation indicates that two variables change together in a predictable way, whereas causation means that a change in one variable directly causes the change in the other. In social science, it is a critical axiom that correlation does not imply causation.
What is the Pareto principle?
The Pareto principle is based on Vilfredo Pareto's 1897 analysis of income distribution in Great Britain and Ireland, describing a specific pattern of distribution often applied to various social and economic phenomena.
What are "stylized facts" in economics?
Stylized facts are empirical regularities—such as Bowley's law or the Phillips curve—that are widely accepted as general patterns in macroeconomic data.
What is data dredging and why is it a concern?
Data dredging occurs when researchers search through a dataset for any statistically significant relationship without a prior hypothesis. This is concerning because it can lead to unreliable conclusions and biased policy recommendations.
What is the Guttman scale?
The Guttman scale is a method for representing ordinal variables, which is particularly useful when dealing with a large number of variables and allows for the application of ordinary least squares techniques.