Cluster Analysis: Principles, Algorithms, and Real-World Applications
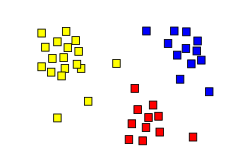
Cluster analysis, commonly known as clustering, is a powerful data analysis technique used to partition a set of objects into groups. The primary goal is to ensure that objects within the same group—called a cluster—exhibit higher similarity to one another than to those in other groups. As a cornerstone of exploratory data analysis, clustering is widely employed across diverse fields, from bioinformatics and machine learning to image analysis and social network research.
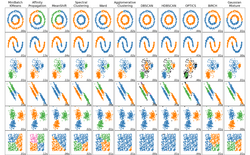
Unlike a single tool, cluster analysis represents a family of algorithms. These methods differ in how they define a "cluster"—which could be based on small distances between members, dense regions of data space, or specific statistical distributions. Because the choice of algorithm and parameter settings (such as distance functions or density thresholds) depends heavily on the dataset, clustering is an iterative process of knowledge discovery rather than a fully automatic task.
Historically, the technique originated in anthropology through the work of Driver and Kroeber in 1932. It was later adopted by psychology in the late 1930s and famously utilized by Cattell starting in 1943 for personality trait classification.
Key Facts
- Core Objective: Grouping objects so that intra-cluster similarity is maximized and inter-cluster similarity is minimized.
- Nature of Process: An iterative, multi-objective optimization process involving data preprocessing and parameter tuning.
- Hard Clustering: A method where each object belongs to exactly one cluster or none at all.
- Versatility: Used in everything from precision medicine and climate science to market research and fraud detection.
- Terminology: Also referred to as automatic classification, numerical taxonomy, botryology, and community detection.
Types of Clustering Approaches
Depending on the structure of the data and the desired outcome, analysts choose from several primary clustering paradigms.
Connectivity-Based (Hierarchical) Clustering
This approach creates a tree of clusters. In agglomerative hierarchical clustering, the process typically starts with each object as its own cluster and merges them based on linkage criteria until a single root cluster is formed.
Centroid-Based Clustering
These algorithms organize data around central points. A prominent example is k-means clustering, which partitions data into k distinct groups by minimizing the distance between data points and their respective cluster centroids.
Model-Based Clustering
This method assumes that the data is generated from a mixture of underlying probability distributions. Gaussian mixture models are a common example of this approach.
Density-Based Clustering
Rather than looking for centers, these algorithms identify clusters as dense regions of data separated by areas of low density. This allows for the discovery of clusters with arbitrary shapes.
Grid-Based Clustering
This technique quantizes the data space into a finite number of cells, forming a grid structure. The density of each cell is calculated, and cells exceeding a specific threshold are grouped into clusters.
Evaluation and Assessment
Evaluating the quality of a clustering result is critical, as there is often no "correct" answer in unsupervised learning. Evaluation is split into two main categories:
Internal Evaluation
Internal metrics assess the quality of the clusters based solely on the data itself. Common indices include:
- Davies–Bouldin index: Measures the average similarity between each cluster and its most similar one.
- Dunn index: Identifies clusters that are compact and well-separated.
- Silhouette coefficient: Measures how similar an object is to its own cluster compared to other clusters.
- AUCC: Area Under the Curve for Clustering.
External Evaluation
External metrics compare the clustering results against a known ground truth or gold standard. Key measures include:
- Purity: The extent to which a cluster contains a single class. Note that purity can be misleadingly high if the number of clusters is too large or the data is imbalanced.
- Rand index, Jaccard index, and Dice index: Various measures of similarity between two partitions.
- V-measure: A combined metric assessing both homogeneity and completeness.
Real-World Applications
Cluster analysis is indispensable for extracting patterns from complex, high-dimensional data.
Natural and Health Sciences
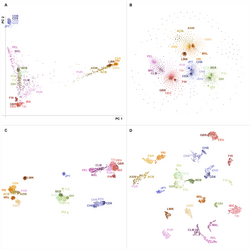
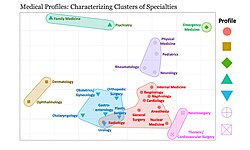
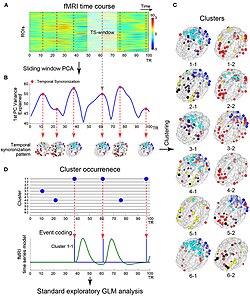
In biology and bioinformatics, clustering is used for sequence analysis and human genetic clustering to reveal population structures. In medicine, it supports precision medicine by identifying patient subgroups with similar health characteristics.
Earth and Environmental Sciences
Researchers apply clustering to geochemistry, petroleum geology, and climate data to categorize environmental patterns and geological formations.
Technology and Data Science
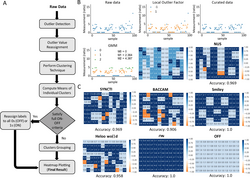
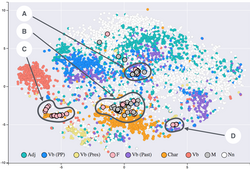
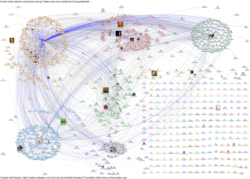
Clustering powers many modern AI capabilities, including image segmentation, anomaly detection, and natural language processing. In the realm of the web, it is used for social network analysis, recommender systems, and search result grouping.
Business and Social Sciences
Companies use clustering for market research and grouping shopping items to improve customer targeting. In social sciences, it is applied to crime analysis, educational data mining, and opinion research.
Summary of Clustering Methods
| Method Type | Core Logic | Common Example | Best Use Case |
|---|---|---|---|
| Connectivity-Based | Hierarchical nesting | Agglomerative Clustering | Taxonomies and hierarchies |
| Centroid-Based | Distance to center | k-means | Spherical, well-separated groups |
| Model-Based | Statistical distribution | Gaussian Mixture Model | Data following known distributions |
| Density-Based | Local point density | DBSCAN | Irregular shapes and noise removal |
| Grid-Based | Spatial quantization | STING | Very large spatial datasets |
Frequently Asked Questions
What is the difference between hard and soft clustering?
Hard clustering assigns each data point to exactly one cluster (or none), whereas soft clustering allows a point to belong to multiple clusters with varying degrees of probability or membership.
Why is purity not always a reliable metric for external evaluation?
Purity can be artificially inflated by increasing the number of clusters; for instance, placing every point in its own cluster results in a perfect purity score of 1. It also performs poorly with imbalanced datasets.
How does hierarchical clustering differ from k-means?
Hierarchical clustering builds a tree-like structure of nested groups and does not require the number of clusters to be specified in advance. k-means requires a pre-defined number of clusters (k) and partitions data into non-overlapping groups based on centroids.
What is the "curse of dimensionality" in cluster analysis?
As the number of dimensions (features) increases, the distance between any two points tends to converge, making it difficult for clustering algorithms to find meaningful similarities. This often necessitates dimensionality reduction techniques like Principal Component Analysis (PCA).
Can clustering be used for supervised learning?
No, clustering is primarily an unsupervised learning technique because it identifies patterns in data that does not have pre-existing labels or target outcomes.