Regional Snowfall Index: How Notable Winter Storms Are Measured
Measuring the impact of a winter storm requires more than just looking at the total inches of snow in a single city. To truly understand the scale of a weather event, meteorologists use the Regional Snowfall Index (RSI), a sophisticated metric that accounts for both the geographical spread and the population affected by a storm relative to historical norms.
The RSI allows experts to compare storms across different regions by normalizing data against climatological records—long-term weather patterns used as a baseline for a specific area.
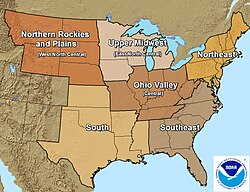
How the RSI is Calculated
The calculation of the RSI is based on four specific snowfall thresholds. These thresholds are not arbitrary; they are derived from historical data to represent different levels of storm intensity:
- Threshold 1: One quarter of the snowfall amount that typically occurs once every 10 years.
- Threshold 2: One half of the snowfall amount that typically occurs once every 25 years.
- Threshold 3: The amount of snow that typically occurs once every 25 years.
- Threshold 4: One and a half times the amount of snow that typically occurs once every 25 years.
Example: The Northeast Region
To illustrate, consider a typical location in the Northeast. If historical data shows that 16 inches of snow occurs once every 10 years and 20 inches occurs once every 25 years, the thresholds for that region would be 4, 10, 20, and 30 inches respectively.
Normalization and Baseline Values
Once the thresholds are established, the RSI determines how widespread a storm is by comparing the current event to a baseline area and baseline population. These baselines represent the average area and population affected by storms already considered "notable."
For every storm, the area and population that exceed each of the four thresholds are divided by these baseline values. Using the Northeast as an example, the area receiving at least 4 inches of snow is divided by 149,228 square miles, and the affected population is divided by 51,553,600 (based on 2010 census data).
This process generates eight distinct numbers (four for area and four for population). The RSI is the sum of these eight values. Because the baselines are calibrated to average storms, a notable storm will typically result in an RSI value of 1.0.
Key Facts
- The RSI is calculated using four distinct snowfall thresholds based on 10-year and 25-year climatological records.
- The index measures both the geographic area and the population affected by a storm.
- A total of eight normalized values are summed to produce the final RSI score.
- The system is calibrated so that the average notable storm yields an RSI of 1.0.
- Baseline data for the Northeast includes a population of 51,553,600 and an area of 149,228 square miles.
| Threshold Level | Calculation Basis | Northeast Example (Inches) |
|---|---|---|
| Threshold 1 | 1/4 of 1-in-10 year event | 4" |
| Threshold 2 | 1/2 of 1-in-25 year event | 10" |
| Threshold 3 | 1-in-25 year event | 20" |
| Threshold 4 | 1.5x of 1-in-25 year event | 30" |
Frequently Asked Questions
What is the Regional Snowfall Index (RSI)?
The RSI is a metric used to quantify the impact of a winter storm by summing normalized area and population data across four different snowfall thresholds.
How are the snowfall thresholds determined?
Thresholds are set using climatological records, specifically looking at the amount of snow that typically occurs once every 10 years and once every 25 years.
What does an RSI value of 1.0 signify?
An RSI of 1.0 represents the average impact of storms within the calibration sample that are considered notable.
Why is population included in the calculation?
Population is included to ensure the index reflects the human impact of the storm, as a storm hitting a densely populated area is more significant than one hitting an uninhabited region.
How many values are summed to create the final RSI?
The RSI is the sum of eight numbers: four representing the normalized area and four representing the normalized population for each of the four thresholds.