Poverty Thresholds: Measuring Global and National Economic Hardship
The poverty threshold—also known as the poverty line, poverty limit, or breadline—is the minimum level of income deemed adequate for a person or family to survive in a specific country. This metric is essential for governments and international organizations to identify vulnerable populations and allocate resources effectively.
Typically, the poverty line is calculated by estimating the total annual cost of basic necessities for an average adult. Because housing costs, such as rent, usually represent the largest expense, economists closely monitor real estate markets to adjust these thresholds. To ensure accuracy, calculations often account for individual circumstances, including age, marital status, disability, and parental responsibilities.
While the concept is universal, the actual monetary value of the poverty line varies significantly between developed and developing nations.
Key Facts
![Poverty headcount ratio at $1.90 a day (2011 PPP) (% of population). Based on World Bank data ranging from 1998 to 2018.[14]](/images/ef/04/ef049c4e7b766af4d98494f42cb0cf09447e058c6a27e3d70dbde93a166b7ac5.png)
- World Bank Update: As of June 2025, the International Poverty Line (IPL) for low-income countries is $3.00 per person per day (PPP).
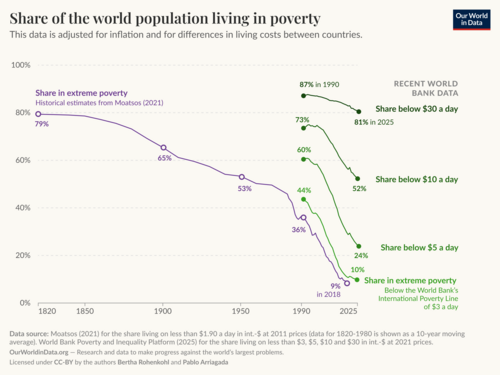
- Global Progress: Based on the $3.00/day standard, global poverty fell from 47.1% in 1981 to 10.3% by 2024.
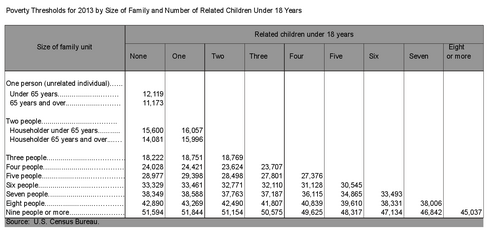
- US Thresholds: In 2020, the US poverty threshold for a single person under 65 was $12,760 annually.
- Demographic Impact: In the US, Black Americans (21%) and adults with disabilities (25%) experience higher poverty rates than White Americans (8.7%).
- Dynamic Nature: Poverty is often fluid; approximately one in three impoverished people were not born into poverty.
Measuring Poverty: Absolute vs. Relative
Absolute Poverty and the International Poverty Line
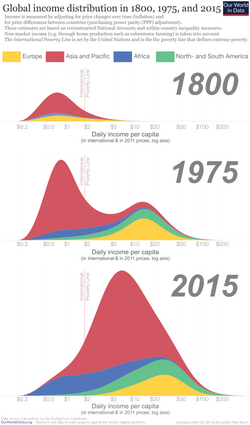
Absolute poverty refers to a condition where household income is insufficient to meet basic survival needs. To track this globally, the World Bank uses the International Poverty Line (IPL), measured in Purchasing Power Parity (PPP)—a metric that adjusts for the different costs of living and inflation rates across countries.
The IPL has evolved over decades to reflect changing economic realities. Originally set at $1.00 per person per day in 1990, it was later updated to $2.15 (based on 2017 PPP) before being raised in June 2025. The current standards are:
- Low-income countries: $3.00 per person per day.
- Lower-middle income countries: $4.20 per person per day.
- Upper-middle income countries: $8.30 per person per day.
Relative Poverty
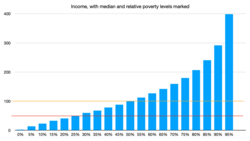
Unlike absolute poverty, relative poverty defines poverty in relation to the general living standards of a specific society. This concept, championed by Rose Friedman in 1965, argues that the definition of "poor" must shift as a society becomes wealthier. For example, a person might have more material goods than a non-poor person from 60 years ago but still be considered relatively poor today because they cannot afford the standard of living common in their current community.
National Poverty Lines and Global Examples
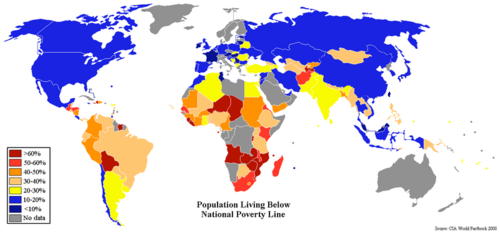
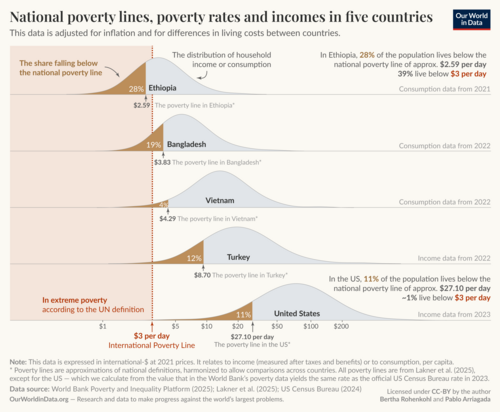
Countries establish their own official poverty lines based on local costs of living. These vary wildly across the globe.
India
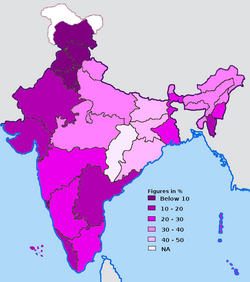
India utilizes separate thresholds for rural and urban areas. As of 2005, the urban poverty line was set at 538.60 rupees (approx. $12) per month, while the rural line was 356.35 rupees (approx. $7.50). Despite these challenges, India has seen significant progress, lifting 271 million people out of poverty between 2005/06 and 2015/16.
United States
The US Census Bureau uses a standardized poverty line across all states. In 2020, the threshold for a family of four (including two children) was $26,200 per year. However, critics argue this model is outdated, as it is based on spending patterns from 1955. Furthermore, because the line does not adjust for regional cost-of-living differences, states like California often show higher poverty rates when housing costs are factored in via the "supplemental poverty measure."
Other International Examples
- Poland: In 2019, the extreme poverty threshold for a single-person household was 614 zł per month.
- United Kingdom: Recent data shows a fluctuation in jobs paid below the National Minimum Wage, with a notable increase between 2019 and 2021 linked to the COVID-19 pandemic.
- Iran: In 2022, amid record inflation, the official poverty line was set at 10 million tomans ($500), while the minimum wage was only 5 million tomans.
Demographics and Social Impacts
Vulnerable Populations
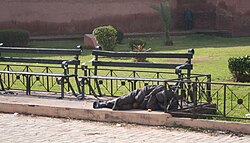
Poverty does not affect all demographics equally. In the US, women and children in single-mother families are significantly more likely to experience poverty. While the overall US poverty rate is 12.3%, the rate for women is 13.8%, compared to 11.1% for men. Conversely, extreme poverty, such as homelessness, disproportionately affects males.
The Role of Public Assistance
Public health programs can act as a critical buffer against economic hardship. Analysis by Georgetown and Health Affairs found that Medicaid expansion between 2010 and 2015 reduced child poverty by 5.3% and significantly narrowed the gap in primary care physician access between low-income and high-income households. It is estimated that 2.6 million people were kept out of poverty due to Medicaid.
Poverty Summary Table
| Metric/Region | Threshold Value | Context/Notes |
|---|---|---|
| World Bank IPL (Low Income) | $3.00 / day | Updated June 2025 (PPP) |
| World Bank IPL (Upper-Middle) | $8.30 / day | Updated June 2025 (PPP) |
| United States (Single Adult) | $12,760 / year | 2020 threshold |
| United States (Family of 4) | $26,200 / year | 2020 threshold |
| India (Urban) | 538.60 rupees / month | 2005 official level |
| Poland (Single Person) | 614 zł / month | 2019 extreme poverty line |
Frequently Asked Questions
What is the difference between absolute and relative poverty?
Absolute poverty is based on a fixed minimum income required to meet basic survival needs (like food and shelter), regardless of where a person lives. Relative poverty is defined by the standard of living in a specific society; a person is relatively poor if their income is significantly lower than the average income of their community.
How does the World Bank calculate the International Poverty Line?
The World Bank uses Purchasing Power Parity (PPP), which adjusts the value of money to account for the different costs of goods and services in different countries, ensuring that the $3.00 daily threshold represents the same actual buying power globally.
Why is the US poverty line criticized by some experts?
Critics argue the US official poverty line is too low because it relies on a spending model from 1955, which does not reflect modern costs of living. Additionally, it does not account for regional differences, meaning the same income threshold is used for both low-cost and high-cost states.
Is poverty a permanent state for those who fall below the line?
No. Poverty is often dynamic. Data indicates that one in three people living in poverty were not born into it, and a large majority of Americans who receive government transfer benefits stop receiving them within 10 years, showing that many individuals move in and out of poverty during their adulthood.
How has Medicaid impacted poverty rates in the US?
Medicaid has been shown to counteract poverty threats by reducing the financial burden of healthcare. Expansion of the program has decreased child poverty and reduced the gap in health insurance and primary care access between impoverished and higher-income individuals.