Poisson Distribution: Modeling Random Events in Time and Space
In the study of probability, certain phenomena appear to occur randomly and independently over a fixed interval of time or space. Whether it is the number of phone calls arriving at a service center, the frequency of meteorites striking Earth, or the number of goals scored in a soccer match, these events often follow a specific mathematical pattern known as the Poisson distribution.
The Poisson distribution is a discrete probability distribution that expresses the probability of a given number of events occurring in a fixed interval, provided these events occur with a known constant mean rate and independently of the time since the last event.

Key Facts
- Core Parameter: The distribution is defined by a single parameter, λ (lambda), which represents the expected average rate of occurrences.
- Nature of Data: It is a discrete distribution, meaning it only applies to natural numbers starting from 0.
- Mathematical Identity: For a Poisson distribution, the mean and the variance are both equal to λ.
- Historical Context: While credited to Siméon Denis Poisson, similar results were noted by Abraham de Moivre in 1711.
- Approximation Power: It serves as an excellent approximation for the binomial distribution when the number of trials is large and the probability of success is small.
Mathematical Foundations
The Poisson distribution is characterized by its Probability Mass Function (PMF). The PMF calculates the probability of observing exactly k events in an interval, given the average rate λ. Because the distribution deals with counts, the function is only defined for integer values of k.
The Role of Lambda (λ)
The parameter λ is the heart of the distribution. It represents the expected number of occurrences in the specified interval. For example, if a call center receives an average of 3 calls per minute (λ = 3), the Poisson model can predict the likelihood of receiving exactly 1, 2, or 5 calls in any given minute. If the calls arrive independently, the probability of receiving between 1 and 4 calls is approximately 0.77, while the probability of receiving 0 or 5 or more calls is roughly 0.23.
Real-World Applications
The versatility of the Poisson distribution allows it to be applied across diverse scientific and commercial fields:
- Telecommunications: Modeling the arrival of telephone calls or web server requests.
- Astronomy: Counting the number of photons hitting a detector or meteorites striking Earth.
- Biology: Tracking DNA mutations per unit length or the number of bacteria in a liquid.
- Finance and Insurance: Estimating the number of insurance claims or losses in a specific period.
- Sports: Predicting the number of goals scored in a match.
- Seismology: Modeling the risk of large earthquakes.
Poisson as a Binomial Approximation
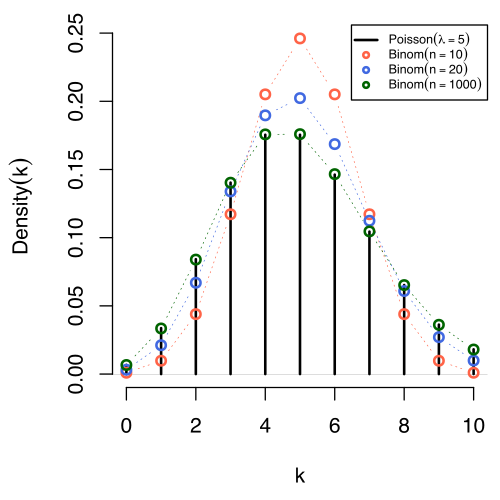
One of the most useful properties of the Poisson distribution is its relationship with the binomial distribution. This is often referred to as the law of rare events. When the number of trials (n) is very large and the probability of success (p) is very small, the binomial distribution converges to the Poisson distribution.
As a rule of thumb, the Poisson distribution provides a good approximation if n is at least 20 and p is less than or equal to 0.05. It becomes an excellent approximation when n is 100 or greater and the product np is 10 or less.
Statistical Summary Table
| Property | Value/Formula |
|---|---|
| Support | Natural numbers {0, 1, 2, ...} |
| Mean | λ |
| Variance | λ |
| Median | Approximately ⌊λ⌋ or ⌈λ⌉ |
| Mode | ⌊λ⌋ (if λ is not an integer) |
Frequently Asked Questions
What are the requirements for using a Poisson model?
For a Poisson model to be valid, the events must occur at a constant average rate, the occurrences must be independent of one another, and two events cannot occur at the exact same instant.
How does the Poisson distribution differ from the Binomial distribution?
The binomial distribution models the number of successes in a fixed number of independent trials, whereas the Poisson distribution models the number of events occurring in a continuous interval of time or space where the number of possible trials is not explicitly defined.
Can the Poisson distribution be used for negative numbers?
No. The Poisson distribution is a discrete distribution used for counting occurrences, so its support is limited to non-negative integers (0, 1, 2, ...).
What happens to the distribution as λ increases?
As the rate parameter λ increases, the shape of the distribution changes. While it is typically skewed for small values of λ, it begins to look more symmetrical and approaches a normal distribution as λ becomes larger.
What is a Poisson process?
A Poisson process is a stochastic process (a mathematical model of a random process) where the number of events in a given time interval follows a Poisson distribution, and the time between consecutive events follows an exponential distribution.