GDP (PPP) Per Capita: Measuring Global Living Standards
When comparing the wealth of nations, simple currency exchange rates often fail to tell the whole story. To get a clearer picture of how people actually live, economists use GDP (PPP) per capita. This metric represents the value of all final goods and services produced within an economy in a given year, divided by the average population, and adjusted for the cost of living.
Unlike nominal GDP, which uses market exchange rates, Purchasing Power Parity (PPP) accounts for the fact that a dollar can buy more in some countries than in others. By neutralizing the effects of inflation and price differences, PPP provides a more accurate reflection of the generalized standard of living across different economies.
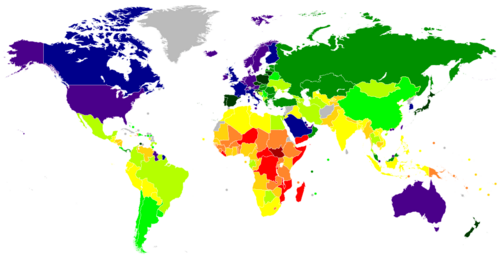
Key Facts
- 2026 Estimate: The estimated average GDP per capita (PPP) for all countries is $25,591.
- Measurement Unit: Figures are typically measured in international dollars, a hypothetical currency with the same purchasing power as the U.S. dollar within the United States.
- Primary Sources: Data is primarily derived from calculations by the International Monetary Fund (IMF) and the World Bank.
- Standard of Living: While a key indicator, it is often used alongside median income and disposable household income for a complete view.
- Shadow Economy: In many European countries, the shadow economy (unreported economic activity) can range from less than 10% to over 40% of GDP.
How GDP (PPP) is Calculated and Used
The process of determining GDP (PPP) per capita involves complex estimates and assumptions. Because different organizations like the IMF and World Bank use varying methodologies, their results for the same country can differ substantially.
PPP vs. Nominal GDP
Nominal GDP focuses on exchange rates and savings, which can be volatile and do not reflect the local cost of living. In contrast, PPP is considered more useful for comparing living standards because it adjusts for the relative cost of goods and services. This prevents exchange rate fluctuations from distorting the real differences in income between nations.
The Role of the International Dollar
To make global comparisons possible, economists use the international dollar. This allows a researcher to compare the purchasing power of a citizen in one country directly against a citizen in another, regardless of the local currency's nominal value.
Economic Distortions and Tax Havens
While GDP (PPP) is a powerful tool, it is not without flaws. Certain jurisdictions produce artificially inflated figures due to their status as tax havens. These are regions that offer low taxes to attract foreign investment, often resulting in "phantom" transactions.
An IMF investigation estimated that approximately 40% of global foreign direct investment flows are artificial, passing through empty corporate shells with no real economic activity. Eight major "pass-through" economies—including the Netherlands, Luxembourg, Hong Kong SAR, the British Virgin Islands, Bermuda, the Cayman Islands, Ireland, and Singapore—host over 85% of these special purpose entities.
The Case of Ireland
Ireland provides a stark example of statistical distortion. Due to U.S. multinational tax avoidance strategies (sometimes called "leprechaun economics"), Ireland's GDP became so distorted that the government effectively abandoned it as a credible measure. In its place, they created Modified Gross National Income (GNI*) to better reflect the actual economy.
Comparison of High GDP (PPP) Jurisdictions
The following table illustrates how various high-ranking economies are categorized by their primary economic drivers, highlighting the prevalence of tax havens and resource-rich nations in the top tiers.
| Country/Territory | Economic Driver / Type |
|---|---|
| Qatar | Oil & Gas |
| Luxembourg | Tax Haven (Sink OFC) |
| Singapore | Tax Haven (Conduit OFC) |
| Brunei | Oil & Gas |
| Ireland | Tax Haven (Conduit OFC) |
| Norway | Oil & Gas |
| United Arab Emirates | Oil & Gas |
| Switzerland | Tax Haven (Conduit OFC) |
| United States | Diversified Economy |
| Saudi Arabia | Oil & Gas |
Frequently Asked Questions
What is the difference between nominal GDP and GDP (PPP)?
Nominal GDP is calculated using current market exchange rates, while GDP (PPP) is adjusted for the cost of living and inflation in each country, making it a better measure of actual purchasing power.
Why are some countries' GDP figures considered "inflated"?
Tax havens often attract "phantom" foreign direct investment—money flowing through corporate shells with no real activity. This increases the total GDP on paper without actually improving the living standards of the local population.
What is an international dollar?
An international dollar is a hypothetical currency used in PPP calculations. It is designed to have the same purchasing power in any given economy as the U.S. dollar has in the United States.
Why did Ireland create GNI*?
Ireland created Modified Gross National Income (GNI*) because its standard GDP figures were heavily distorted by the accounting practices of large multinational corporations using the country as a tax haven.
Does GDP (PPP) per capita perfectly measure quality of life?
No. While it is a strong indicator of living standards, it has been criticized for not capturing all aspects of well-being. Other measures, such as median income and disposable household income, are often used to provide a more nuanced view.