Boiling-Point Diagrams and K-Values in Vapor-Liquid Equilibrium
In chemical engineering and thermodynamics, understanding how a mixture of substances transitions between liquid and vapor phases is critical for designing separation processes. This relationship is known as Vapor-Liquid Equilibrium (VLE). To visualize and calculate these transitions, engineers rely on boiling-point diagrams and distribution ratios known as K-values.
Boiling-Point Diagrams for Binary Mixtures
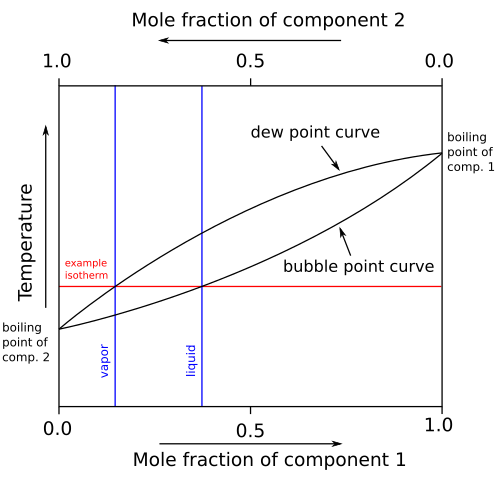
A boiling-point diagram is a two-dimensional graph that illustrates the VLE data of a binary mixture (a mixture of two components) at a constant overall pressure, such as 1 atm. The graph typically plots temperature (T) against the mole fraction (the ratio of moles of one component to the total moles) of component 1, denoted as x1.
In any binary mixture, the sum of the mole fractions must equal one: x1 + x2 = 1. For mixtures with n components, this generalizes to x1 + x2 + ... + xn = 1.
When a mixture boils, the vapor and liquid phases often have different compositions. These are represented on the diagram by two distinct curves:
- Bubble Point Curve: The lower curve, which represents the mole fraction of the boiling liquid at various temperatures.
- Dew Point Curve: The upper curve, which represents the mole fraction of the vapor at various temperatures.
These curves meet at the points where the mixture consists of a pure component (x1 = 0 or x1 = 1), where the temperature corresponds to the boiling point of that pure substance.
Azeotropes: Special Equilibrium Points
In some substance pairs, the bubble point and dew point curves meet tangently at a point between the pure components. This point is called an azeotrope. At an azeotropic composition, the liquid and vapor phases have identical mole fractions, meaning the mixture boils without changing composition.
- Minimum-boiling azeotropes: The azeotrope temperature is at a minimum relative to the pure components.
- Maximum-boiling azeotropes: The azeotrope temperature is at a maximum.
Representing Multi-Component Systems
Visualizing VLE for three or more components is more complex. For a three-component mixture, a three-dimensional graph is required, where two dimensions represent composition and the third represents temperature. Composition is often shown as an equilateral triangle, where each corner is a pure component and any point inside represents a mixture of all three.
In this model, the bubble and dew points form curved surfaces within a triangular prism. Because 3D diagrams are difficult to interpret, they are often converted into 2D graphs using isotherm lines (lines of constant temperature), similar to contour lines on a topographic map. One set of isotherms represents the bubble point surface, and another represents the dew point surface.
K-Values and Relative Volatility
For mixtures with four or more components, graphical diagrams become impractical. Instead, engineers use K-values, also known as vapor-liquid distribution ratios. The K-value for a component (i) is defined as the ratio of its mole fraction in the vapor phase (yi) to its mole fraction in the liquid phase (xi):
Ki = yi / xi
Depending on the behavior of the mixture, K-values are calculated using different laws:
- Raoult's Law: Ki = Pi* / P (where Pi* is the vapor pressure of the pure component and P is the total pressure).
- Modified Raoult's Law: Ki = γiPi* / P (where γi is the activity coefficient, accounting for non-ideal behavior).
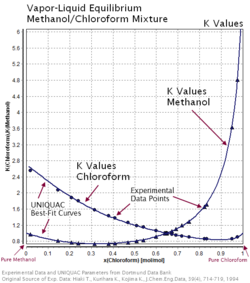
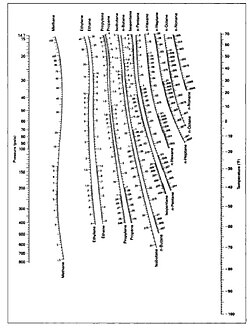
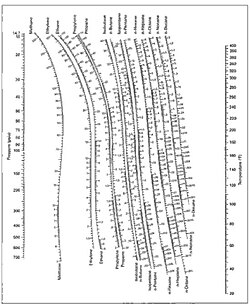
K-values are often determined through empirical correlations, tables, or specialized tools like DePriester charts.
Relative Volatility
For binary mixtures, the ratio of the K-values of the two components is called the relative volatility (α). This value indicates how easily two components can be separated via distillation:
α = Ki / Kj = (yi / xi) / (yj / xj)
Industrial distillation is generally not viable if the relative volatility is less than 1.05, as the components are too similar in volatility to be separated efficiently.
Key Facts
- Bubble Point: The temperature/composition where the first bubble of vapor forms.
- Dew Point: The temperature/composition where the first drop of liquid condenses.
- Azeotrope: A mixture that boils at a constant composition, where liquid and vapor mole fractions are equal.
- K-Value: The ratio of vapor mole fraction to liquid mole fraction (yi/xi).
- Relative Volatility (α): A measure of separation ease; values below 1.05 typically make industrial distillation impractical.
| Concept | Definition/Formula | Primary Use |
|---|---|---|
| Mole Fraction (x, y) | Moles of component / Total moles | Defining phase composition |
| Bubble Point Curve | Lower curve on T-x diagram | Identifying boiling start point |
| Dew Point Curve | Upper curve on T-x diagram | Identifying condensation start point |
| K-Value | Ki = yi / xi | Multicomponent VLE calculations |
| Relative Volatility | α = Ki / Kj | Assessing distillation feasibility |
Frequently Asked Questions
What is the difference between a bubble point and a dew point?
The bubble point is the temperature at which the first bubble of vapor forms when heating a liquid. The dew point is the temperature at which the first drop of liquid forms when cooling a vapor.
Why are azeotropes significant in distillation?
Azeotropes are significant because they represent a limit to separation. Since the vapor and liquid compositions are identical at the azeotropic point, standard distillation cannot further purify the mixture beyond that composition.
How is relative volatility used in industry?
Relative volatility measures the ease of separating two components. If α is high, separation is easy. If α is very close to 1 (specifically below 1.05), the components are too similar to be separated economically using large-scale industrial distillation.
How are three-component mixtures represented on a 2D graph?
They are represented using an equilateral triangle for composition, with the 3D bubble and dew point surfaces projected as sets of curved isotherm lines (constant temperature lines) across the triangle.
When is the modified Raoult's law used instead of the standard Raoult's law?
The modified Raoult's law is used when the mixture is non-ideal. It introduces an activity coefficient (γ) to account for the interactions between different molecular species in the liquid phase.