1860 United States Census: A Snapshot of a Nation on the Brink
The 1860 United States census serves as a critical historical record, capturing the demographic and social landscape of a country just before it descended into the American Civil War. Conducted by the Census Office starting on June 1, 1860, and spanning five months, this eighth national census documented a population in a state of rapid growth and deep internal division.
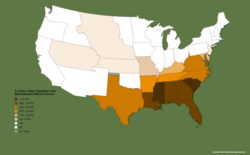
The results revealed a total population of 31,443,321 people across 33 states and 10 organized territories. This represented a significant increase of 35.6% compared to the 23,191,876 people recorded in the 1850 census. However, this growth occurred against a backdrop of systemic inequality, as the total population included 3,953,760 enslaved persons.
Key Facts
- Total Population: 31,443,321 (a 35.6% increase from 1850).
- Most Populous State: New York, with 3,880,735 residents.
- Least Populous State: Oregon, with 52,465 residents.
- Enslaved Population: 3,953,760 people.
- Census Superintendent: Joseph C. G. Kennedy.
- Primary Occupations: Farming and general labor dominated the workforce.
The Impact of the Civil War on Data
The timing of the census coincided with the onset of the American Civil War. Because the nation was sinking into conflict by the time the returns were ready for tabulation, Superintendent Joseph C. G. Kennedy and his staff were only able to produce an abbreviated set of public reports. These reports lacked the usual graphic or cartographic representations found in other censuses.
Despite the limited public release, the census data was utilized for military intelligence. The staff created specialized maps for Union field commanders that highlighted militarily vital information, including the distribution of the white and slave populations, primary agricultural products by county, and essential transportation routes via rail and post roads.
Urban Growth and City Rankings
The 1860 data highlighted significant shifts in urban populations. Most notably, Philadelphia regained its status as the second-most-populous city in the United States, a position it had lost to Baltimore in 1820. This surge was the direct result of the Act of Consolidation of 1854, which merged several surrounding townships—including Kensington, Northern Liberties, and Spring Garden—into the city proper.
| Rank | City | State | Population |
|---|---|---|---|
| 1 | New York | New York | 813,669 |
| 2 | Philadelphia | Pennsylvania | 565,529 |
| 3 | Brooklyn | New York | 266,661 |
| 4 | Baltimore | Maryland | 212,418 |
| 5 | Boston | Massachusetts | 177,840 |
| 6 | New Orleans | Louisiana | 168,675 |
| 7 | Cincinnati | Ohio | 161,044 |
| 8 | St. Louis | Missouri | 160,773 |
| 9 | Chicago | Illinois | 112,172 |
| 10 | Buffalo | New York | 81,129 |
Census Methodology and Schedules
The 1860 census utilized two distinct schedules to categorize the population. This separation reflected the legal status of people at the time, where enslaved individuals were legally considered property.
Schedule 1: Free Inhabitants
This schedule collected detailed personal and economic data, including:
- Name, age, sex, and color (White, Black, or Mulatto).
- Profession, occupation, or trade for those over 15.
- Value of real and personal estate owned.
- Place of birth and literacy status (for those over 20).
- Whether the person had attended school within the year.
- Health or legal status (e.g., blind, insane, pauper, or convict).
Schedule 2: Slave Inhabitants
This schedule focused on the ownership and characteristics of enslaved people, recording:
- The name of the slave owner and the number of slaves.
- Age, sex, and color of the enslaved person.
- Whether the person was a fugitive from the state.
- The number of people manumitted (legally freed).
- The number of slave houses.
Economic Insights and Human Capital
The 1860 census provides a window into the American economy of the mid-19th century. National data shows that farmers (both owners and tenants) comprised nearly 10% of utilized occupations, followed by farm laborers (3.2%) and general laborers (3.0%).
Localized data reveals specialized industrial hubs. In Essex, Massachusetts, for example, shoe-making and shoe-binding were dominant occupations for men and women, respectively. This underscores the era's reliance on rigorous physical labor.
The census also touched upon human capital—the skill sets and efficiency workers bring to the labor force. Data from IPUMS indicates that only 0.2% of the population was enrolled in school or identified as a "Student," suggesting a very slow rate of growth in formal educational proficiency during this period.
Frequently Asked Questions
Which state had the largest population in 1860?
New York was the most populous state, with a total of 3,880,735 residents.
How did the 1860 census differ from previous ones in its reporting?
Due to the onset of the American Civil War, the public reports were abbreviated and lacked the graphic and cartographic representations typically included in census publications.
What was the significance of the Act of Consolidation of 1854?
The Act merged several smaller townships into Philadelphia, allowing the city to regain its position as the second-most-populous city in the U.S. by 1860.
What were the most common jobs in the United States in 1860?
Farming was the most common occupation, with farmers making up nearly 10% of the workforce, followed by farm laborers and general laborers.
How was the enslaved population recorded?
Enslaved people were recorded on a separate form called Schedule 2 (Slave Inhabitants), which listed the owner's name and the characteristics of the enslaved individuals.