Wise Demographics: A Comprehensive Population and Socioeconomic Analysis
The town of Wise has experienced a dynamic demographic evolution over the last century and a half. From its early growth in the late 19th century to its modern stabilization, the town's population trends reflect broader regional shifts in residency and economic activity.
Historically, Wise saw rapid expansion between 1880 and 1980, peaking at 3,894 residents. However, recent decades have seen a gradual decline, with the 2020 census recording 2,970 people—a decrease of approximately 10 percent compared to the population two decades prior.
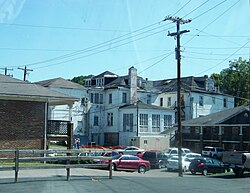
Key Facts
- Peak Population: 3,894 residents recorded in 1980.
- Current Trend: A projected population of 2,853 by 2025.
- Population Density: 1,059.4 people per square mile (as of 2000).
- Median Age: 38 years.
- Racial Composition: Predominantly White (95.24%).
Population Growth and Trends
The growth of Wise was particularly aggressive at the turn of the 20th century. Between 1890 and 1900, the population surged by 174.7%, growing from 186 to 511 residents. This upward trajectory continued steadily through the mid-century, with a significant jump of 66.1% between 1950 and 1960.
After reaching its zenith in 1980, the town entered a period of fluctuation. A notable decline occurred between 1980 and 1990, where the population dropped by 18%. While the numbers stabilized around 3,200 for several decades, the most recent census data indicates a continuing downward trend.
| Census Year | Population | Percentage Change (%) |
|---|---|---|
| 1880 | 128 | — |
| 1900 | 511 | 174.7% |
| 1940 | 1,226 | 10.3% |
| 1960 | 2,614 | 66.1% |
| 1980 | 3,894 | 34.7% |
| 2000 | 3,255 | 1.9% |
| 2020 | 2,971 | -9.6% |
| 2025 (est.) | 2,853 | -4.0% |
Community Composition and Housing
Based on the 2000 census, the town's social fabric is characterized by a high percentage of White residents (95.24%), with smaller populations of African Americans (1.94%), Asians (1.14%), Native Americans (0.28%), and those of other or mixed races. Hispanic or Latino residents make up 1.41% of the population.
Household Dynamics
The town consists of 1,424 households, with an average size of 2.17 people. Family structures vary, with 47% of households being married couples and 39% categorized as non-families. Approximately 26.3% of households include children under the age of 18, while 14% consist of individuals aged 65 or older living alone.
Housing Density
With 1,594 housing units, the town maintains an average housing density of 518.8 units per square mile. This supports a general population density of 1,059.4 people per square mile.
Age and Gender Distribution
The population is distributed across various age brackets, with the largest group being those aged 25 to 44 (30.7%). This is followed by the 45 to 64 age group (23.4%) and those under 18 (19.7%). Residents aged 65 and older represent 15% of the population.
The gender ratio is nearly balanced, with 101.4 males for every 100 females. Among adults aged 18 and over, the ratio shifts slightly to 99.7 males for every 100 females.
Economic Indicators
Economic data reveals a disparity in income levels. The median household income is $28,531, while the median family income is higher at $36,875. There is a notable gap in earnings by gender, with males earning a median income of $30,170 compared to $21,389 for females.
The per capita income for the town is $18,760. Poverty remains a challenge for a segment of the population, with 15.6% of all residents and 12.6% of families living below the poverty line. This includes 15.3% of children under 18 and 11.6% of seniors aged 69 or older.
Frequently Asked Questions
What is the current population trend in Wise?
The population has been gradually declining since its peak in 1980. As of 2020, there were 2,971 residents, and it is estimated to drop to 2,853 by 2025.
What is the median age of residents in Wise?
The median age of the population is 38 years.
What is the racial makeup of the town?
The town is predominantly White (95.24%), with smaller percentages of African American, Asian, Native American, and Hispanic or Latino residents.
What are the median income levels for households and families?
The median income for a household is $28,531, while the median income for a family is $36,875.
What percentage of the population lives below the poverty line?
Approximately 15.6% of the total population lives below the poverty line, including 15.3% of those under age 18.