Waitematā and Gulf Ward Demographics and Population Trends
The Waitematā and Gulf ward is a diverse and dynamic region covering 489.05 km (188.82 sq mi). As of June 2025, the estimated population has reached 80,500, resulting in a population density of 163 people per square kilometer.
Key Facts
- 2023 Census Population: 74,130 residents.
- Median Age: 34.4 years, notably lower than the national average of 38.1.
- International Diversity: 45.2% of residents were born overseas, significantly higher than the national rate of 28.8%.
- Economic Standing: Median income is $48,100, exceeding the national median of $41,500.
- Education: 46.2% of residents aged 15 and over hold a bachelor's degree or higher.
Population Growth and Trends
The population of the Waitematā and Gulf ward has experienced fluctuations over the last two decades. According to the 2023 New Zealand census, the population stood at 74,130. This represents a 2.2% decrease (1,686 people) from the 2018 census, though it remains 5.6% higher (3,960 people) than the 2013 figures.
Historically, the population was 71,619 in 2006, though it should be noted that the 2006 data covered a slightly larger area of 494.61 km.
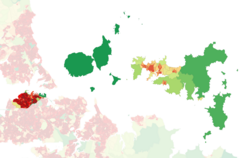
Population History Table
| Year | Population | Annual Change (±% p.a.) |
|---|---|---|
| 2006 | 71,619 | — |
| 2013 | 70,170 | −0.29% |
| 2018 | 75,816 | +1.56% |
| 2023 | 74,130 | −0.45% |
Community Profile and Diversity
The ward is characterized by a young and diverse population. The gender distribution consists of 36,969 males, 36,555 females, and 609 people of other genders. Additionally, 9.5% of the population identifies as LGBTIQ+.
Age Distribution
The age structure shows a strong concentration of working-age adults:
- Under 15 years: 7,074 (9.5%)
- 15 to 29 years: 22,491 (30.3%)
- 30 to 64 years: 36,162 (48.8%)
- 65 years or older: 8,403 (11.3%)
Ethnicity and Language
Residents may identify with multiple ethnicities. The primary groups include European (Pākehā) at 63.9%, Asian at 26.9%, Māori at 9.6%, Pasifika at 6.0%, and Middle Eastern, Latin American and African New Zealanders (MELAA) at 4.8%. Another 1.7% identified as "other," including those who listed their ethnicity simply as "New Zealander."
English is the dominant language, spoken by 96.3% of the population. Other spoken languages include Māori (2.4%), Samoan (1.0%), and various other languages (29.2%). New Zealand Sign Language is known by 0.3% of residents.
Socio-Economic Indicators
The ward exhibits high levels of educational attainment and income. Among residents aged 15 and older, 46.2% (30,999 people) hold a bachelor's degree or higher, and 35.8% (24,039 people) have a post-high school certificate or diploma. Only 17.9% hold exclusively high school qualifications.
Economically, the region outperforms national averages. The median income is $48,100, compared to the national $41,500. Furthermore, 20.4% of residents earn over $100,000, significantly higher than the national average of 12.1%.
Employment Status
For those aged 15 and over, the employment breakdown is as follows:
- Full-time employment: 36,633 (54.6%)
- Part-time employment: 9,591 (14.3%)
- Unemployed: 2,595 (3.9%)
Religion and Beliefs
A majority of the population (59.9%) reports having no religion. Among those with religious affiliations, the largest group is Christian (23.7%), followed by Hindu (3.8%), Buddhist (2.1%), Islam (1.8%), and other religions (1.8%). Smaller percentages identify with Māori religious beliefs (0.5%), New Age (0.6%), and Jewish (0.3%) faiths. Approximately 5.6% of residents did not answer the census question regarding religion.
Frequently Asked Questions
What is the current population density of the Waitematā and Gulf ward?
As of June 2025, the population density is estimated at 163 people per square kilometer.
How does the median age of the ward compare to the rest of New Zealand?
The median age in the ward is 34.4 years, which is younger than the national median age of 38.1 years.
What percentage of the population was born outside of New Zealand?
45.2% of the population was born overseas, which is considerably higher than the national average of 28.8%.
What are the most common educational qualifications in the region?
The most common qualification is a bachelor's degree or higher, held by 46.2% of residents aged 15 and older.
How does the income in this ward compare to the national average?
The median income is $48,100, which is higher than the national median of $41,500. Additionally, a higher percentage of residents (20.4%) earn over $100,000 compared to the national rate of 12.1%.