Unemployment: Causes, Measurement, and Economic Impact
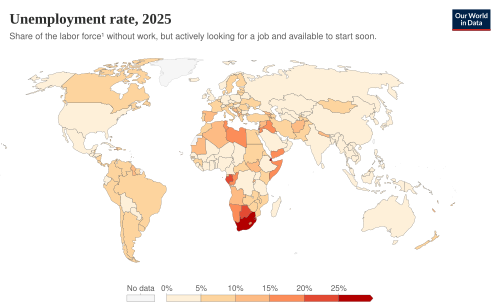
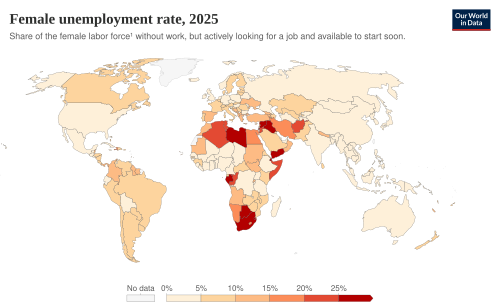
Unemployment occurs when an individual is not in paid employment or self-employment but is currently available for work. It is a critical indicator of a country's economic health, typically measured by the unemployment rate—the percentage of the total labor force that is currently jobless during a specific reference period.
The labor force consists of all people above a specified age who are either employed or actively seeking work. Because this metric fluctuates based on economic cycles, government policies, and global trends, understanding the nuances of how it is measured and what causes it is essential for economists and policymakers alike.
Key Facts
- Measurement: The unemployment rate is calculated as the number of unemployed persons divided by the total labor force.
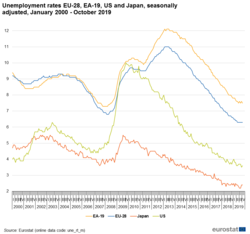
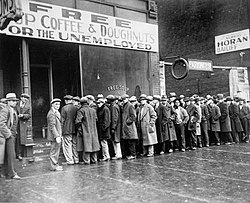
- Global Impact: During the Great Depression (1932), unemployment reached approximately 25% in both the United States and Germany.
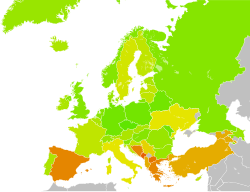
- Youth Vulnerability: Young workers are often hardest hit during recessions; for example, Spain's youth unemployment rate reached 43.8% in November 2009.
- Labor Force Exclusions: Full-time students, prisoners, and homemakers are generally not counted as part of the labor force or as unemployed.
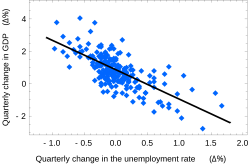
- Economic Correlation: Okun's Law describes the relationship between unemployment and the rate of growth in Gross Domestic Product (GDP).
Causes of Unemployment
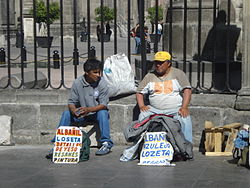
Unemployment rarely stems from a single source. Instead, it is usually the result of a complex interplay of economic, social, and political factors:
- Economic Status: Recessions lead to a drop in demand for goods and services, reducing the need for labor.
- Globalization: International trade and global competition can shift industries across borders.
- Technological Advancement: New inventions and automation can replace human labor in certain sectors.
- Government Policy: Regulations, market interventions, and tax policies influence hiring trends.
- External Shocks: Wars, civil disorder, and natural disasters can disrupt entire labor markets.
- Personal Factors: Poor work-life balance or the need for significant time off can lead to unemployment.
Types of Unemployment and Economic Theories
Economists categorize unemployment to better understand the appropriate remedy for each situation.
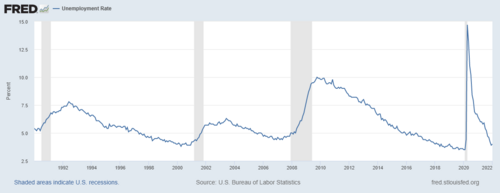
Cyclical Unemployment
This type of unemployment is directly tied to the business cycle. It increases during economic downturns (recessions) and decreases during periods of expansion.
Structural and Frictional Unemployment
Structural unemployment occurs when there is a mismatch between the skills workers possess and the skills employers need, often due to technological shifts. Frictional unemployment is the temporary period when a worker is searching for or transitioning from one job to another.
Other Forms of Unemployment
- Real Wage Unemployment: Occurs when wages are kept above the market-clearing level.
- Hidden Unemployment: People who are unemployed but not captured in official statistics because they have stopped seeking work.
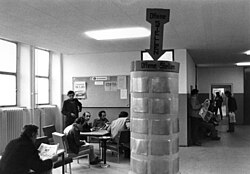
- Long-term Unemployment: Individuals who remain jobless for extended periods, often requiring specialized government toolkits or employment services to reintegrate.
Economic Models
Several theories explain the persistence of unemployment. The Shapiro–Stiglitz model suggests that efficiency wages (paying above market rate) are used to prevent workers from "shirking," which prevents wages from dropping to a level that would employ everyone.

Additionally, the Phillips Curve historically suggested a trade-off between inflation and unemployment, though modern analysis notes that the unemployment rate is an inaccurate predictor of inflation in the long term.
![Short-run Phillips curve before and after Expansionary Policy, with Long-Run Phillips Curve (NAIRU). Note, however, that the unemployment rate is an inaccurate predictor of inflation in the long term.[20][21]](/images/2c/0c/2c0ce080dcb7e10e777b77070ae446727aa1859ed58742729ce258451ce38a5a.webp)
Measuring the Labor Market
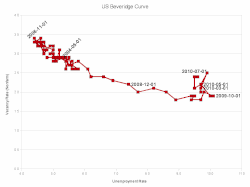
Different organizations use different criteria to define and measure unemployment. The International Labour Organization (ILO) and Eurostat generally define an unemployed person as someone aged 15 to 74 (16 to 74 in some countries) who is without work, available to start within two weeks, and has actively sought work in the last four weeks.
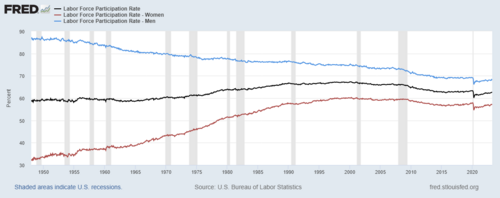
Labor Force Participation Rate
The participation rate measures the proportion of the working-age population that is either employed or unemployed. It is calculated as the labor force divided by the labor force population (typically those aged 15–64).
U.S. Bureau of Labor Statistics (BLS) Measures
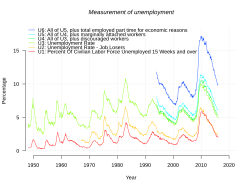
The BLS provides several measures (U-1 through U-6) to give a more complete picture. While U-3 is the official unemployment rate, U-6 is a broader measure that includes "marginally attached workers" and those working part-time for economic reasons.
NEET and Youth Unemployment
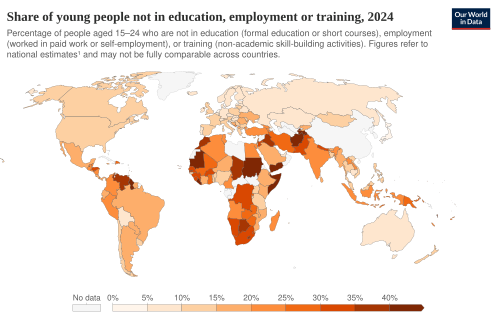
The term NEET refers to youth who are "Not in Education, Employment, or Training." This group is often a primary focus for policymakers due to the long-term negative effects of early-career unemployment.
Comparison of Labor Metrics
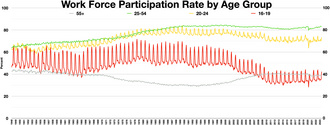
It is important to distinguish between the unemployment rate and the employment rate, as they can provide counterintuitive results. For example, in 2004, France had a higher unemployment rate than the US for men aged 25-54, yet a slightly higher overall employment rate for that same demographic.
| Metric | Definition | Formula/Calculation |
|---|---|---|
| Unemployment Rate | Percentage of labor force without a job | (Unemployed / Labor Force) × 100 |
| Participation Rate | Percentage of working-age population in the labor force | (Labor Force / Working-Age Population) |
| Employment Rate | Percentage of working-age population currently employed | (Employed / Working-Age Population) |
| NEET | Youth not in education, employment, or training | Categorical count of youth population |
Historical Context and Remedies
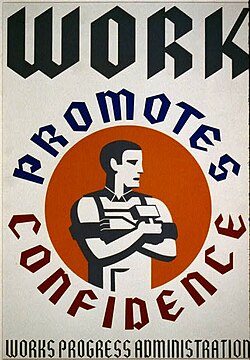
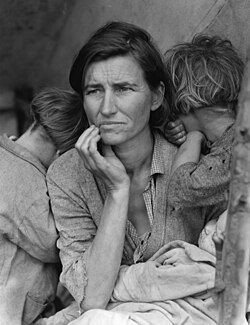
Historically, unemployment has led to significant social unrest and government intervention. During the 1930s Great Depression, the U.S. implemented the Works Progress Administration (WPA) to provide federal employment.
Proposed Solutions
- Demand-side solutions: Increasing overall demand in the economy to create more jobs.
- Supply-side solutions: Proponents argue that lower taxes lead to employment growth. Research suggests that tax decreases for lower-income earners (bottom 90%) correlate more strongly with employment growth than tax cuts for high-income earners.
- Labor Market Flexibility: Reducing regulations to make it easier for companies to hire and fire workers.
Frequently Asked Questions
![Unemployment rate in the US by county in 2008[63] 1.2–3% 3.1–4% 4.1–5% 5.1–6% 6.1–7% 7.1–8% 8.1–9% 9.1–10% 10.1–11% 11.1–13% 13.1–22.9%](/images/ee/1b/ee1b6723710a8ef72671c32963f5ef8adf6589992655ddc3bb9921ba82dd20c8.webp)
![Supply-side economics proposes that lower taxes lead to employment growth.[136]](/images/7d/fb/7dfb5669b99de6ce35ffe10de2d560d895e4c92d10309cdf4f42905f1dc3a4ad.jpg)
![Tax decreases on high income earners (top 10%) are not correlated with employment growth, but tax decreases on lower-income earners (bottom 90%) are correlated with employment growth.[136]](/images/ff/76/ff76d6bdd2175c68807e4cf9eb75bdf9e4f4e693455c03febf7ae20b17dcbb7a.jpg)
![Unemployment rate of Japan.[161] Red line is G7 average. 15-24 age (thin line) is youth unemployment.](/images/3d/e9/3de9fb25eff87c35d7157ddaf246927ad1e30b9888e36b28c72e7c6e83e5cc11.webp)
Why aren't homemakers counted as unemployed?
To be classified as unemployed, a person must be actively available for and seeking paid work. Since homemakers are not seeking monetary employment, they are not considered part of the labor force.
What is the difference between U-3 and U-6 unemployment?
U-3 is the official rate counting only those actively seeking work. U-6 is a broader measure that includes discouraged workers (marginally attached) and those working part-time who desire full-time employment.
How does incarceration affect unemployment statistics?
Prisoners are not counted as part of the labor force. Consequently, an increase in the prison population can artificially lower the measured unemployment rate.
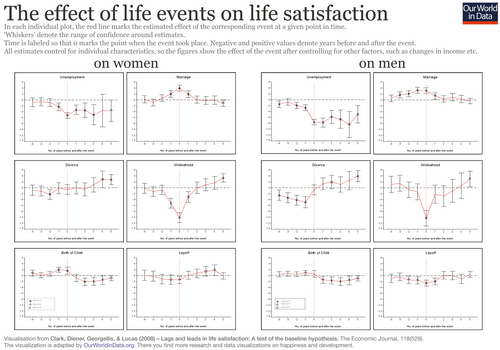
What is the impact of unemployment on life satisfaction?
Unemployment is identified as one of the life events with the most long-lasting negative effects on an individual's overall life satisfaction.