Oil and Gas Reserves and Resource Quantification
Quantifying oil and gas reserves and resources is the critical process of estimating the volume of hydrocarbons trapped in subsurface accumulations and determining how much of that volume can be extracted profitably. Because these accumulations are hidden deep underground, estimates are inherently uncertain and rely on a blend of geological, engineering, and economic data.
In the petroleum industry, a fundamental distinction is made between resources—the total estimated volume of hydrocarbons in place—and reserves—the specific quantities expected to be commercially recoverable under current technological, regulatory, and economic conditions.

Key Facts
- Reserves are commercially recoverable; Resources are the total volumes in place.
- The PRMS (Petroleum Resources Management System) is the global standard for classification.
- Proven Reserves (1P) have a 90% probability (P90) of being recovered.
- Probable (2P) and Possible (3P) reserves represent incremental volumes with lower certainty.
- Prospective Resources are undiscovered and carry the highest risk.
- Reserve Growth occurs when subsequent production data increases the estimated ultimate recovery of a field.
The PRMS Classification Framework
To provide investors and management with a standardized way to compare assets, the industry uses the Petroleum Resources Management System (PRMS). Developed jointly by the Society of Petroleum Engineers (SPE) and other professional bodies, PRMS categorizes hydrocarbons based on their maturity and commercial viability.
Public companies in the U.S. must also adhere to Securities and Exchange Commission (SEC) requirements, which closely align with PRMS but historically focused primarily on proven reserves.
Reserves: Proven, Probable, and Possible
Reserves are discovered accumulations that are commercial and recoverable. They are divided into three sub-categories:
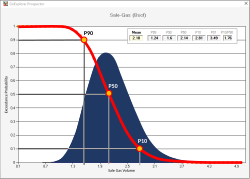
- Proven (1P): These have a reasonable certainty of recovery. In probabilistic terms, this is the P90 volume, meaning there is a 90% chance that the actual recovered amount will equal or exceed this estimate. Proven reserves can be Developed (PD), requiring minimal investment, or Undeveloped (PUD), requiring new wells or capital investment.
- Probable (2P): These are additional volumes added to the proven reserves. The cumulative sum of proven and probable reserves is the P50 estimate, representing a 50% probability of recovery.
- Possible (3P): These are the least certain discovered volumes, often based on varying geological interpretations. The cumulative sum of all three categories is the P10 estimate, meaning there is only a 10% chance of exceeding this volume.
Non-Reserve Resources
Not all discovered hydrocarbons qualify as reserves. Some remain as resources due to technical or economic barriers:
- Contingent Resources: These are discovered accumulations that cannot yet be commercially developed. Their status as reserves is contingent on a change in conditions, such as a rise in oil prices or a technological breakthrough. They are classified as 1C, 2C, or 3C.
- Prospective Resources: These are undiscovered accumulations. They carry the highest risk and the widest range of uncertainty, categorized as 1U, 2U, and 3U.
![Schematic graph illustrating petroleum volumes and probabilities. Curves represent categories of oil in assessment. There is a 95% chance i.e., probability, (P95 and often referred to in the industry as F95) of at least volume V1 of economically recoverable oil, and there is a 5% chance (P05 or F05) of at least volume V2 of economically recoverable oil.[16]](/images/23/e3/23e3baf118986f5d018f13ae839f00e9d1511cce9fb2338766c83eb20bac3f0c.jpg)
Estimation Techniques
Engineers and geologists use several methodologies to quantify these volumes, ranging from simple comparisons to complex computer simulations.
| Resource Class | Low Uncertainty | Mid Uncertainty | High Uncertainty | Common Estimation Methods |
|---|---|---|---|---|
| Reserves | 1P (Proven) | 2P (Probable) | 3P (Possible) | Volumetric, Material Balance, Decline Curve |
| Contingent Resources | 1C | 2C | 3C | Probabilistic Models, Static Reservoir Models |
| Prospective Resources | 1U | 2U | 3U | Analog (YTF), Probabilistic Models |
Common Quantification Methods
- Volumetric Method: Calculates volume based on the geometry of the trap, the rock's porosity, and the recovery factor.
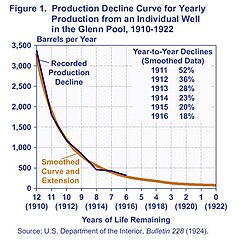
- Performance-Based Methods: These use actual production data. Decline Curve Analysis tracks the drop in production over time to predict the remaining volume.
- Material Balance: Uses pressure and production data to estimate the size of the reservoir.
- Reservoir Simulation: Employs dynamic computer models to simulate fluid flow within the subsurface.
Reserve Growth and Global Trends
It is common for initial estimates of new fields to be conservative. Reserve growth refers to the tendency for estimated ultimate recovery to increase as a field is produced and more data becomes available. However, the accuracy of these reports can vary; some national governments may provide unaudited claims that are suspected of political manipulation.
In recent years, the focus has shifted toward climate goals. In 2021, the International Energy Agency (IEA) suggested that to meet the Paris Agreement, countries should cease expanding exploration and investing in projects that expand reserves.
Frequently Asked Questions
What is the difference between 1P, 2P, and 3P reserves?
1P (Proven) is the volume with a 90% probability of recovery. 2P (Proven + Probable) has a 50% probability, and 3P (Proven + Probable + Possible) has a 10% probability of being recovered.
What are contingent resources?
Contingent resources are discovered hydrocarbon accumulations that are not yet commercially viable. They require a change in economic, technical, or regulatory conditions before they can be reclassified as reserves.
How does the SEC differ from PRMS in reporting?
While both use similar frameworks, the SEC has historically been more restrictive, primarily requiring the reporting of proven reserves (1P) for companies listed on U.S. exchanges, though optional 2P and 3P reporting is now permitted.
What is a P90 estimate?
A P90 estimate is a conservative volume calculation where there is a 90% probability that the actual amount of recoverable hydrocarbons will be equal to or greater than the estimated value.
What causes reserve growth?
Reserve growth occurs as more data is gathered during the production phase of a field, often revealing that the reservoir is larger or more productive than initial geological models suggested.