Income Distribution and the Global Dynamics of Economic Inequality
Income distribution refers to how a country's total Gross Domestic Product (GDP) is shared among its population. For economists and policymakers, the way wealth and earnings are spread across a society is a central concern, as an unequal distribution often leads to systemic economic inequality. This disparity affects everything from social stability to the overall pace of economic growth.
Historically, classical economists like Adam Smith, Thomas Malthus, and David Ricardo focused on factor income distribution—how income is split between the primary factors of production: land, labor, and capital. In contrast, modern economists shift their focus toward the distribution of income across individuals and households, examining the delicate balance between inequality and economic expansion.
Key Facts
- The Gini index is the primary tool for measuring inequality, ranging from 0 (perfect equality) to 1 (perfect inequality).
- As of 2016, the global Gini index was measured at 0.52.
- Labor unions are shown to reduce income inequality, with more significant effects observed in the public sector than the private sector.
- The United States exhibits some of the highest levels of income inequality in the Western world, particularly after taxes and transfers.
- Nordic countries generally maintain the lowest Gini coefficients and poverty rates globally.
Measuring Economic Inequality
To quantify how income is distributed, organizations such as the United Nations, the World Bank, and the CIA rely on the Gini coefficient. This statistical measure provides a reliable way to compare inequality across different nations. A score of 0 represents a society where everyone earns the exact same amount, while 1 represents a scenario where a single individual earns all the income.
Beyond the Gini index, economists analyze income mobility—the ability of individuals to move between different income brackets over time—and the impact of government interventions like progressive taxation and transfer payments.
![Global map of countries by high inequality (based on Gini index), 2022, according to the Poverty and Inequality Platform (PIP)[13] <30 30-35 35-40 40-45 45-50 50+](/images/73/e6/73e64824ff061eeb02d6295e36d672822f32959430b634b3a875abbe25c91fad.png)
Global Trends and Wealth Gaps
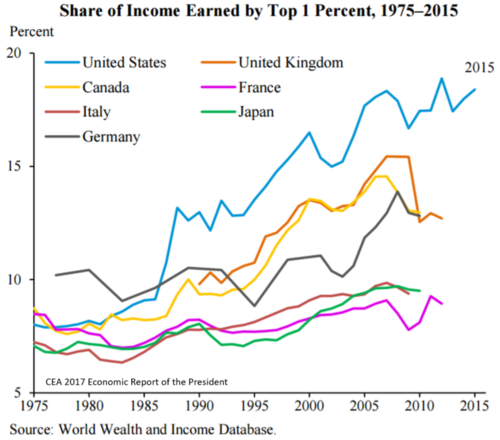
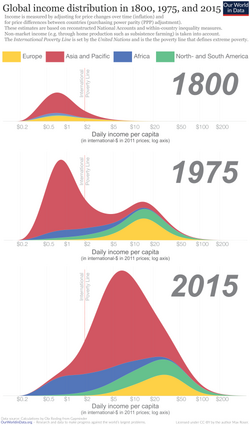
Income distribution has shifted dramatically over the last two centuries. Between 1820 and the 1980s, the inter-country Gini coefficient more than doubled, rising from 0.20 to 0.52. While some scholars argue that inequality has stabilized or decreased since 1980 due to the rise of economies like China and India, others point to the extreme concentration of wealth at the top.
In the United States, the wealth gap has shown stark racial disparities. A 25-year study found that the wealth gap between Caucasian and African-American families nearly tripled from $85,000 in 1984 to $236,500 in 2009. Factors contributing to this gap include home ownership (27%), household income (20%), education (5%), and inheritance (5%).
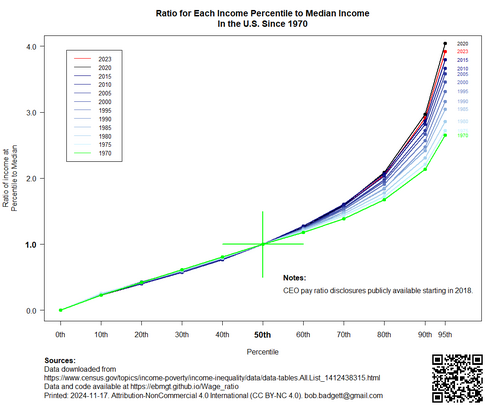
The concentration of wealth is not limited to the top 1%. Data suggests that those above the median income have seen relative gains far outpace those below the median since 1970, though this trend saw a dip in 2023.
The Impact of Redistribution
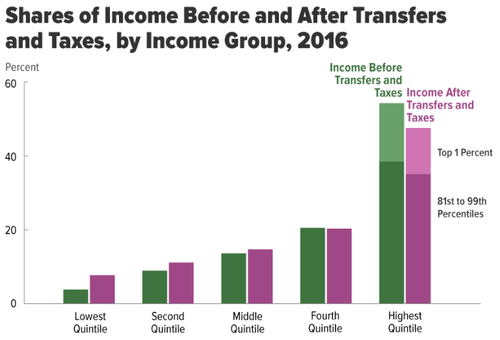
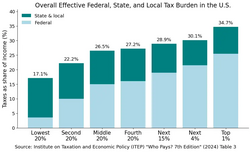
Taxes and transfer payments play a critical role in modifying market income. In many developed nations, the gap between "before-tax" and "after-tax" income is significant, as governments redistribute wealth to support lower-income quintiles.
Regional Analysis of Income Distribution
The Americas
The United States is characterized by high inequality; by 2011, the top 20% of earners made more than the bottom 80% combined. In 2016, the top 1% earned an average of $1.8 million, roughly 30 times the income of the middle quintile. In Brazil, inequality has seen a decline between 2004 and 2014 (Gini falling from 0.54 to 0.49), attributed to social programs like Bolsa Família and increases in the minimum wage.
Asia and Africa
China has experienced rapid growth since the late 1970s, but its Gini coefficient rose from 0.31 in 1981 to 0.491 in 2008. This is largely driven by the urban-rural income gap, exacerbated by migration constraints. India showed moderate to high inequality in 2011, with a Gini coefficient between 0.33 and 0.36. Thailand has also struggled with extreme disparity; as of 2013, the top 20% of landowners held 80% of the nation's land. South Africa remains one of the most unequal societies globally, with a dual economy that maintains a sharp racial divide; black South Africans earn, on average, three times less than white South Africans.
Europe
The Nordic countries (Denmark, Sweden, Norway, Finland, and Iceland) consistently report the lowest Gini coefficients, often below 0.30, and extremely low poverty rates. In the United Kingdom, inequality spiked during the 1980s but remained more stable through the 1990s and 2000s. In Czechia, wage distribution continues to be a key metric for economic health.
![Czech wage distribution 2024[64]](/images/7b/2d/7b2df4504f8b888483856fcdb1a63a31e6b4b4ee282c376481b95a3d405c97f1.png)
Recent data from 2025 highlights the varying thresholds for the top 10% of earners in Europe. In Luxembourg, a household needs approximately €175,000 annually to be in the top decile, whereas in Bulgaria, the threshold is only about €21,900.
Theoretical Frameworks
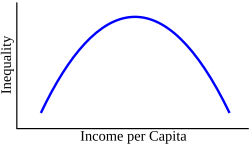
Economists often use the Kuznets curve, a hypothetical model suggesting that as a country develops, inequality first increases and then decreases as the society matures.
Other theories explore the role of labor unions in redressing inequality. Research by David Card and others indicates that unionization significantly reduces wage gaps, particularly in the public sector. For example, in the U.S., unionization reduced wage inequality by 16.2% for men and 10.7% for women in the public sector, compared to much smaller reductions in the private sector.
Summary of Global Income Metrics
| Country/Region | Gini Coefficient | GDP per Capita | Poverty Rate |
|---|---|---|---|
| Nordic Countries (Avg) | ~0.26 - 0.30 | High ($62k - $121k) | Very Low (0% - 0.8%) |
| United States | High (Western peak) | $53,632 | Not specified |
| China | 0.371 (2020) | $21,482.6 (2022) | 2% (2020) |
| Brazil | 0.52 (2022) | $17,827.6 (2022) | 1.4% (2023) |
| Japan | Not specified | $40,850 | 15.7% |
Frequently Asked Questions
What is the Gini index and how is it interpreted?
The Gini index is a statistical measure of income distribution between a population. It ranges from 0 to 1, where 0 represents perfect equality (everyone has the same income) and 1 represents perfect inequality (one person has all the income).
How do labor unions affect income inequality?
Labor unions generally reduce income inequality by negotiating better wages for workers. This effect is more pronounced in the public sector; for instance, in the U.S., the reduction in wage inequality was significantly higher in public sector employment than in the private sector.
Why is the urban-rural gap significant in China?
The urban-rural gap is a primary driver of China's Gini coefficient. Institutional and social barriers, including constraints on migration, have limited the ability of rural residents to move to cities for higher-paying jobs, maintaining a wide income disparity.
What is the difference between market income and disposable income?
Market income is the income earned before taxes and government transfers. Disposable income (or income after taxes and transfers) is what remains after the government redistributes wealth through taxes and social welfare payments.
How does the Kuznets curve explain inequality?
The Kuznets curve is a hypothetical model suggesting that in the early stages of economic development, income inequality increases as people move from low-productivity agriculture to higher-productivity industry. Eventually, inequality is expected to decline as the economy matures and wealth spreads.