Consumer Spending: Drivers, Macroeconomic Factors, and US Trends
Consumer spending refers to the total amount of money that individuals and households spend on final goods and services. As a primary engine of economic activity, it reflects the purchasing power and confidence of the general population. To understand how this spending works, economists divide it into two distinct categories: induced consumption, which fluctuates based on income levels, and autonomous consumption, which remains constant regardless of income.
Consumers can buy a large range of goods and services at shopping malls.

Key Facts
- Consumer spending is a core component of the Gross Domestic Product (GDP) equation: GDP = C + I + G + NX.
- In the United States, the top 10% of earners (those making over $250,000) accounted for 49.7% of all consumer spending in 2024.
- Spending is categorized into durable goods, nondurable goods, and services.
- Consumer sentiment acts as a powerful predictor of economic health and investment confidence.
- US consumer spending as a percentage of GDP has fluctuated historically, from 50% during World War II to 71% in 2013.
Macroeconomic Factors Influencing Spending
The Role of Taxes
Governments use tax policies as a tool to adjust the economy. By manipulating taxes, policymakers aim to either stimulate or suppress consumer spending and influence overall consumer confidence. However, the exact impact of these changes is often a subject of economic debate.
This relationship is illustrated by the GDP equation: GDP = C + I + G + NX, where C represents private consumption, I is private investment, G is government spending, and NX is net exports (exports minus imports). While increased government spending (G) can drive demand and economic expansion, it often leads to higher taxes or deficit spending, which may negatively impact private consumption (C) and investment (I).
Consumer Sentiment
Consumer sentiment is the general attitude of the public toward the economy and fiscal markets. Because spending is heavily influenced by perception, sentiment is a strong predictor of economic trends. When consumers feel confident about the future, they are more likely to spend and invest. Conversely, poor sentiment leads to reluctance in spending.
Not all households react to sentiment in the same way. Some maintain a strict budget where consumption and savings closely equal their income, while others allow their emotional outlook on the economy to dictate their spending habits.
Government Economic Stimulus
During periods of economic uncertainty, governments may issue economic stimuli, such as rebates or checks, to encourage spending. Despite these efforts, such measures sometimes fail. This is often because consumers are reluctant to rapidly shift their spending habits or, recognizing that the stimulus is a response to a downturn, choose to save the money rather than spend it.
Consumer Spending in the United States
Historically, the role of consumer spending in the US economy has shifted significantly. In 1929, it represented 75% of the economy, rising to 83% in 1932 as business spending declined. During World War II, it dropped to approximately 50% due to a lack of consumer products and massive government expenditures. From 1960 to 1981, it remained steady at about 62% of GDP, eventually rising to 71% by 2013.
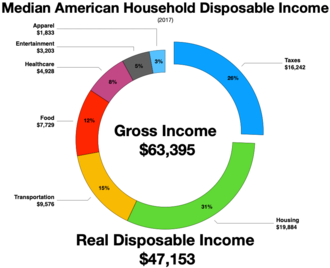
The Bureau of Economic Analysis (BEA) classifies US personal spending into three broad categories:
- Durable goods: Long-lasting items such as motor vehicles, parts, furnishings, durable household equipment, and recreational vehicles.
- Nondurable goods: Items consumed quickly, including clothing, footwear, gasoline, energy goods, and food and beverages bought for off-premises consumption.
- Services: Intangible offerings such as housing, utilities, healthcare, transportation, financial services, insurance, and recreation.
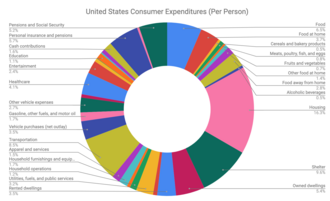
Data from the U.S. Census Bureau and the Bureau of Labor Statistics highlight significant income inequality. In 2024, the top 10% of earners—those making more than $250,000—were responsible for nearly half (49.7%) of all US consumer spending.
| Category | Description | Examples |
|---|---|---|
| Durable Goods | Long-term use products | Cars, Furniture, Appliances |
| Nondurable Goods | Short-term use products | Food, Clothing, Gasoline |
| Services | Intangible value/labor | Healthcare, Rent, Insurance |
Frequently Asked Questions
What is the difference between induced and autonomous consumption?
Induced consumption is spending that changes based on the level of a consumer's income, whereas autonomous consumption is the baseline spending that occurs regardless of income levels.
How does the GDP equation relate to consumer spending?
In the equation GDP = C + I + G + NX, consumer spending is represented by "C" (private consumption). It is one of the primary drivers of a nation's total economic output.
Why do government stimulus checks sometimes fail to boost the economy?
Stimulus measures may fail because people are often hesitant to change their spending habits quickly or may save the money instead of spending it due to fears associated with the economic downturn that prompted the stimulus.
Which group has the most impact on US consumer spending?
High-income earners have a disproportionate impact; as of 2024, the top 10% of earners (making over $250,000) accounted for 49.7% of all consumer spending in the United States.