Cedar Falls Demographics: Population Trends and Community Profile
Cedar Falls, Iowa, serves as a key component of the Waterloo-Cedar Falls metropolitan area. Over the last century and a half, the city has evolved from a small settlement into a thriving urban center, characterized by steady growth and a diverse community structure. By analyzing decennial census data, we can trace the city's trajectory from its early days to its current status as a modern hub.
Population Growth and Historical Trends
The population of Cedar Falls has seen significant fluctuations and periods of rapid expansion since the late 19th century. Starting with 3,070 residents in 1870, the city experienced its most dramatic growth spurts between 1940 and 1970, reflecting broader national trends of urbanization and regional development.
While there were minor declines in 1880, 1910, and 1990, the overall trend has been upward. By the 2020 census, the population reached 40,713, marking a consistent increase from the 36,145 residents recorded at the turn of the millennium.
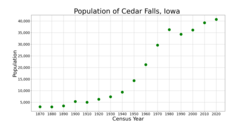
The following table provides a detailed breakdown of the population changes recorded by the U.S. Decennial Census.
| Census Year | Population | Percentage Change |
|---|---|---|
| 1870 | 3,070 | — |
| 1900 | 5,319 | 53.8% |
| 1950 | 14,334 | 53.3% |
| 1970 | 29,597 | 39.6% |
| 2000 | 36,145 | 5.4% |
| 2020 | 40,713 | 3.7% |
Key Facts
- 2020 Population: 40,713 residents.
- Population Density: 1,401.8 inhabitants per square mile.
- Median Age: 31.4 years (as of 2020).
- Urbanization: 97.0% of residents live in urban areas.
- Housing: 16,997 total housing units with a 6.9% vacancy rate.
- Racial Composition: 87.5% White, 4.7% Two or more races, 3.2% Asian, and 3.1% Black or African American.
Community Composition and Age Distribution
The demographic profile of Cedar Falls reveals a relatively young population. In 2020, the median age—the age that divides a population into two numerically equal groups—was 31.4 years. This is a notable increase from the 2010 median age of 26.8 and the 2000 median age of 26.
Age distribution in 2020 showed that 19.3% of the population was under 18, while 17.2% were 65 years of age or older. Gender ratios have remained relatively stable, with 93.3 males for every 100 females in 2020, compared to 88.5 males per 100 females in 2000.
Household and Housing Dynamics
As of 2020, there were 15,827 households in the city. The structure of these households varies significantly:
- Married-couple households: 45.8%
- Female householder (no spouse/partner): 26.6%
- Male householder (no spouse/partner): 21.1%
- Single-person households: 30.6%
Housing availability is tight, with only a 6.9% overall vacancy rate. Specifically, the homeowner vacancy rate stands at 1.8%, while the rental vacancy rate is higher at 8.5%.
Racial and Ethnic Diversity
Cedar Falls has seen a gradual increase in racial and ethnic diversity over the last two decades. While the majority of the population identifies as White (87.5% in 2020, down from 95.14% in 2000), other groups have grown.
The Asian community grew from 1.61% in 2000 to 3.2% in 2020. Similarly, the percentage of residents identifying as two or more races increased from 1.09% to 4.7%. The Hispanic or Latino population, which includes people of any race, rose from 1.08% in 2000 to 2.9% in 2020.
Economic Indicators
Based on data from the 2000 census, the city showed a strong economic foundation with a median household income of $70,226 and a median family income of $85,158. During that period, the per capita income was $27,140. Poverty rates were relatively low, with 4.7% of the total population living below the poverty line, though this figure was higher for those under age 18 (8.5%).
Frequently Asked Questions
What is the current population of Cedar Falls?
According to the 2020 census, the population of Cedar Falls is 40,713.
How has the median age changed over time?
The median age has steadily increased, rising from 26 years in 2000 to 26.8 years in 2010, and reaching 31.4 years by 2020.
What is the racial makeup of the city?
As of 2020, the city is 87.5% White, 4.7% Two or more races, 3.2% Asian, 3.1% Black or African American, 1.0% Some other race, 0.3% Native Hawaiian/Pacific Islander, and 0.2% American Indian/Alaska Native.
What percentage of residents live in rural areas?
Only 3.0% of Cedar Falls residents live in rural areas, with the vast majority (97.0%) residing in urban areas.
What are the current housing vacancy rates?
The overall vacancy rate is 6.9%, with a specific homeowner vacancy rate of 1.8% and a rental vacancy rate of 8.5%.