Capacity Factor in Electricity Generation
In the world of energy production, the net capacity factor is a critical metric used to measure the efficiency and utilization of power plants. Put simply, it is the unitless ratio of the actual electrical energy output over a specific period compared to the theoretical maximum output that could have been produced if the plant operated at full nameplate capacity—its maximum rated output—continuously throughout that same period.
This metric is applicable to all types of electricity producing installations, from traditional fuel-consuming power plants to renewable sources like wind, solar, and hydroelectric dams. By calculating the average capacity factor, engineers and policymakers can compare the performance and reliability of different energy technologies.
Key Facts
- Definition: The ratio of actual energy output to the maximum theoretical output over a given time.
- Upper Limit: A capacity factor can never exceed the availability factor (the total uptime of the plant).
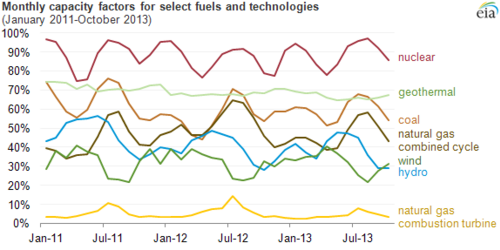
- Nuclear Lead: Nuclear power typically maintains the highest capacity factors due to continuous operation.
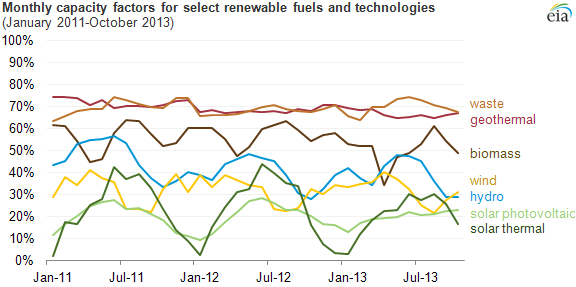
- Renewable Variability: Solar and wind factors are primarily limited by the availability of their natural "fuel" (sunlight and wind).
- Economic Impact: Peaking plants often have low capacity factors, making their electricity relatively expensive due to high fixed costs.
How Capacity Factor is Calculated
The capacity factor is typically computed over a year to smooth out short-term fluctuations, though monthly calculations are used to analyze seasonal trends. It can also be measured over the entire operational lifetime of a facility or converted into full load hours.
The basic formula is as follows:
Capacity Factor = Actual Energy Output / (Nameplate Capacity × Time Period)
For example, if a plant with a nameplate capacity of 1 megawatt (MW) produces 0.5 megawatt-hours (MWh) of electricity in one hour, its capacity factor for that hour is 0.5 (or 50%).
Performance Across Different Energy Sources
Nuclear Power
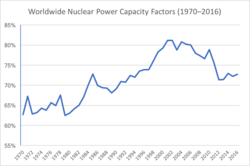
Nuclear plants operate at the high end of the capacity spectrum. Their output is generally reduced only by the availability factor, specifically during scheduled maintenance and refueling. For instance, the Palo Verde Nuclear Generating Station in the US, with a capacity of 3,942 MW, generated 31,200,000 MWh in 2010. Notably, in 2019, the Prairie Island 1 unit reached a capacity factor of 104.4%.
Wind Energy
Wind farm capacity factors vary based on location and turbine design. The Horns Rev 2 offshore wind farm in Denmark has a nameplate capacity of 209.3 MW and an average annual production of 875 GWh. In contrast, the Fosen Vind project in Norway projected a lower capacity factor of 39%.
Seasonality plays a major role; in Finland, the capacity factor during winter can be more than double that of July. While US annual factors from 2013 to 2016 ranged between 32.2% and 34.7%, some onshore plants, like the Eolo plant in Nicaragua, have reached 60.2%.
Hydroelectric Power
Hydroelectric capacity is heavily dependent on water availability and regulation. The Three Gorges Dam in China, the world's largest by installed capacity (22,500 MW), generated 87 TWh in 2015. The Hoover Dam, with a capacity of 2,080 MW, averages 4.2 TWh annually, though this has fluctuated historically between 2.648 TWh and 10.348 TWh.
Solar Photovoltaics (PV)
Solar capacity factors are influenced by geography and weather. The Agua Caliente Solar Project in Arizona (290 MW capacity) produces an average of 740 GWh/year. However, the Lauingen Energy Park in Bavaria, Germany, achieves a much lower capacity factor of 12.0% due to its more northern latitude.
Determinants of Capacity Factors
Several factors prevent a power plant from achieving a 100% capacity factor:
- Technical Constraints: Maintenance, reliability issues, and the overall availability factor.
- Economic and Market Forces: Plants may be curtailed (intentionally left idle) if electricity demand is low or prices are too low to make production economical. This is common for peaking power plants.
- Resource Availability: Intermittent renewables depend on the weather. Solar depends on sunlight and cloud cover, while wind depends on wind speed. Hydroelectric plants may limit output to conserve water or protect downstream fish populations.
- Regulatory and Grid Constraints: Air permits, transmission limits, and government risk tolerance regarding grid resilience (to prevent outages from natural disasters or attacks) can force plants to curtail output.
Comparative Capacity Data
The following table summarizes typical and historical capacity factors across various energy sources and regions.
| Energy Source | Global/Regional Average | Typical Range/Notes |
|---|---|---|
| Nuclear Power | 88.7% (US 2006-2012) | Highest stability; limited by refueling |
| Hydroelectricity | 44% (Worldwide) | 10% to 99% based on water availability |
| Wind Farms | 21% to 52% (as of 2022) | Highly variable by location/season |
| Solar PV | 10% to 19% (EU/US) | Limited by day/night and cloud cover |
| Geothermal | High | Generally available continuously |
Frequently Asked Questions
Can a capacity factor ever be over 100%?
While theoretically the ratio is based on nameplate capacity, some units may occasionally report figures over 100% if they operate slightly above their rated nameplate capacity for a period, as seen with Prairie Island 1 in 2019.
What is the difference between capacity factor and availability factor?
The availability factor refers to the percentage of time a plant is capable of producing electricity (uptime). The capacity factor is the actual energy produced relative to the maximum possible. A plant can be available (uptime) but not producing energy due to low demand or lack of fuel.
Why do solar and wind have lower capacity factors than nuclear?
Nuclear plants can run continuously regardless of weather. Solar and wind are intermittent; they cannot produce power when the sun is down or the wind is not blowing, which naturally lowers their average annual output relative to their maximum potential.
How does "curtailment" affect the capacity factor?
Curtailment occurs when a plant is forced to reduce its output, even if the resource (wind/sun) is available, because the grid cannot handle the power or the market price is too low. This reduces the actual energy output, thereby lowering the capacity factor.
Does the Betz coefficient affect the capacity factor of wind turbines?
No. The Betz coefficient (approx. 59.3%) limits how much energy a turbine can extract from the wind. The capacity factor measures actual production relative to the turbine's own rated capacity, not the total energy available in the wind.