Biological Networks: Mapping the Complex Interconnections of Life
In the intricate dance of life, no molecule, gene, or organism acts in total isolation. Instead, biological systems function through a vast web of interactions. To make sense of this complexity, scientists use biological networks—mathematical methods that represent systems as sets of binary interactions or relations between various biological entities.
At its core, a network (or graph) captures the relationships between objects. These objects, known as nodes, are connected by edges. In a standard network, an $N \times N$ matrix represents these connections, where $N$ is the number of nodes. Typically, an entry of 1 denotes an edge between two nodes, while a 0 indicates no connection. To add more nuance, researchers often use weighted graphs, where each edge is assigned a weight to indicate the strength or relevance of the connection.
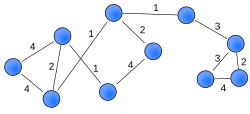
The Evolution of Network Theory
The mathematical foundation of these systems dates back to 1736, when Leonhard Euler analyzed the Seven Bridges of Königsberg. His work established the field of graph theory, providing the tools necessary to study paths and connections.
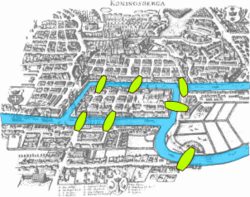
The field progressed significantly through the 20th century. Between the 1930s and 1950s, the study of random graphs emerged. However, by the mid-1990s, researchers discovered that "real-world" networks possess structural properties fundamentally different from random ones. This realization led to the study of scale-free and small-world networks, which eventually shaped the modern emergence of systems biology, network biology, and network medicine. By 2014, graph theoretical methods were being actively applied to analyze complex biological networks.
Diverse Types of Biological Networks
Biological networks are not monolithic; they exist at every scale of life, from the molecular level to entire ecosystems. Understanding these different layers is essential for modern medicine and biology.
Molecular and Cellular Networks
- Protein–protein interaction networks: Mapping how proteins physically interact to perform cellular functions.
- Gene regulatory networks: DNA–protein interaction networks that control gene expression.
- Gene co-expression networks: Transcript–transcript association networks that show which genes are active at the same time.
- DNA-DNA chromatin networks: Mapping the physical architecture of DNA within the nucleus.
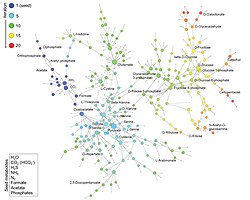
- Metabolic networks: Representing the chemical reactions and pathways within a cell.
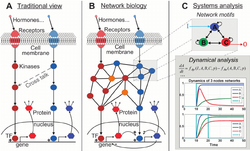
- Signaling networks: Visualizing how cells communicate via chemical signals.
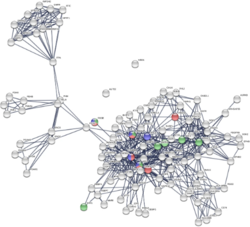
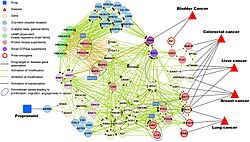
Higher-Order and Ecological Networks
Beyond the cell, networks describe how organisms interact with one another and their environments.
- Neuronal networks: The complex wiring of the brain.
- Food webs: The interconnected feeding relationships in an ecosystem.
- Network medicine: Using network properties to understand human diseases.
- Between-species and Within-species interaction networks: Studying how different species interact or how individuals within a single species relate to one another.
Key Facts
- Graph Theory Origin: Founded by Leonhard Euler in 1736 through the Königsberg bridge problem.
- Network Representation: Uses nodes (entities) and edges (connections), often represented by an $N \times N$ matrix.
- Weighted Edges: Allow researchers to show the strength or importance of a connection.
- Scale-Free Properties: Real-world biological networks differ significantly from purely random networks.
- Multidisciplinary Impact: Network theory is vital to systems biology, network medicine, and ecology.
Analyzing Network Structure: Centrality and Modules
To understand which parts of a network are most important, scientists use centrality measures. These mathematical scores help identify "hub" nodes—entities that play a disproportionately large role in the system.
Common Centrality Metrics
Different metrics provide different insights into a node's importance:
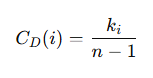
- Degree Centrality: Measures the number of direct connections a node has.
- Betweenness Centrality: Measures how often a node acts as a bridge along the shortest paths between other nodes.
- Eigenvector Centrality: Assigns scores based on the idea that connections to high-scoring nodes contribute more to a node's score.
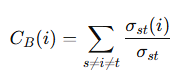
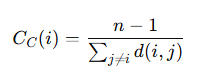
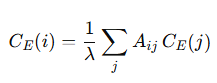
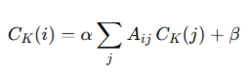
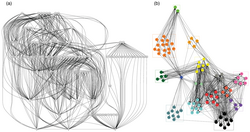
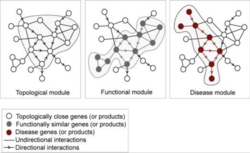
Beyond individual nodes, networks are often organized into communities or modules—groups of nodes that are more densely connected to each other than to the rest of the network. Identifying these modules helps researchers find functional units within a cell or ecosystem.
Visualizing Chromatin Networks
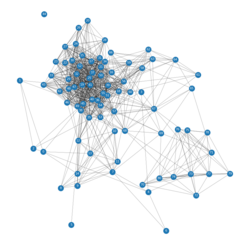
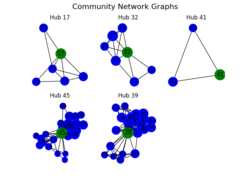
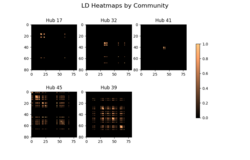
In DNA-DNA chromatin networks, researchers use specific visualizations to understand how the genome is organized. For example, the mouse Hist1 region can be analyzed through linkage disequilibrium to identify hubs and heat map representations of connectivity.
Summary of Network Concepts
| Concept | Definition | Biological Application |
|---|---|---|
| Node | An individual entity in the system | A protein, gene, or species |
| Edge | A connection between two nodes | A chemical reaction or physical interaction |
| Weighted Edge | An edge with an assigned value | The strength of a gene co-expression |
| Degree Centrality | Count of direct connections | Identifying highly connected proteins |
| Community | A cluster of highly connected nodes | A functional protein complex |
Frequently Asked Questions
What is the difference between a random network and a biological network?
Random networks have connections distributed more uniformly, whereas biological networks often exhibit "scale-free" properties, meaning they contain specific highly-connected hubs that hold the system together.
Why is centrality important in network medicine?
Centrality helps identify "hub" genes or proteins that are critical to biological processes. Disrupting these hubs often leads to disease, making them primary targets for medical intervention.
How are weighted networks used in biology?
Weights allow scientists to represent the intensity of an interaction, such as the level of correlation between two genes or the strength of a metabolic flux, rather than just noting if an interaction exists.
What are network motifs?
Network motifs are small, recurring patterns of interconnections that appear more frequently in biological networks than would be expected in random networks, often serving specific functional roles.
Can networks be used to study ecosystems?
Yes, ecological networks like food webs use these principles to model how species interact and how the loss of one species might impact the stability of the entire community.